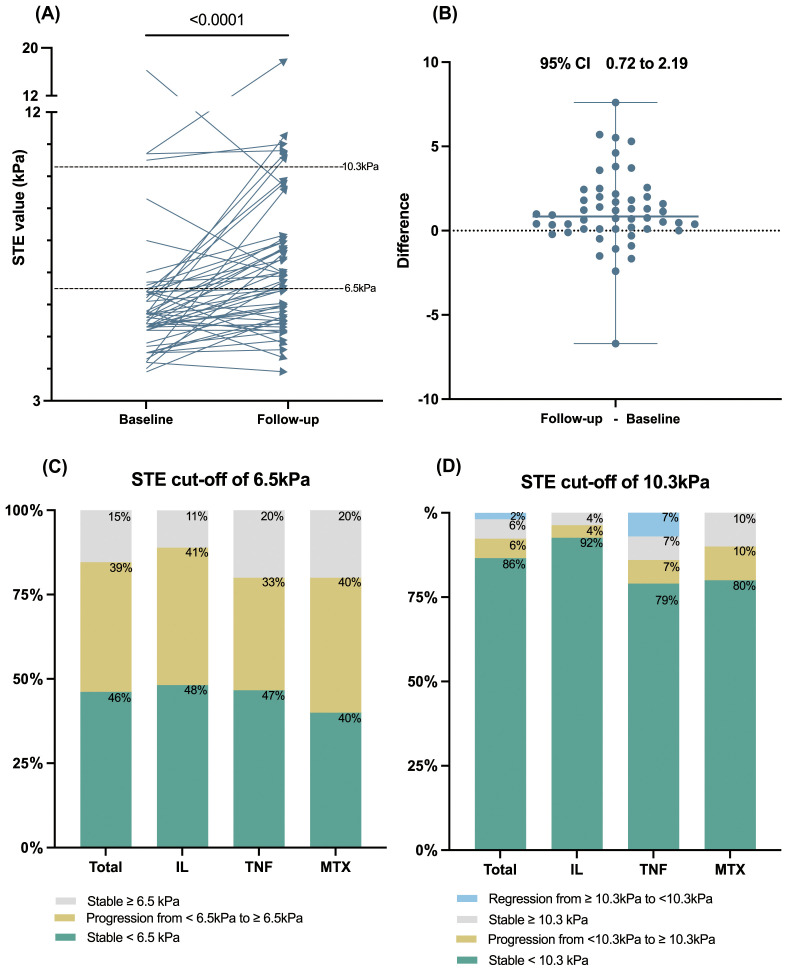
Figure 1.
The longitudinal change of STE value among patients with psoriasis during follow-up. (A) The STE values significantly elevated after over one year of psoriatic systemic monotherapy (n=52). (B) The differences plot of the STE value change. (C, D) Percentage of patients with stable, regressed, or progressed STE at a cutoff value of 6.5 kPa or 10.3 kPa, displayed for the total cohort and IL, TNF, and MTX subgroups. STE, sound touch elastography; IL, interleukin; TNF, tumor necrosis factor; MTX, methotrexate.

