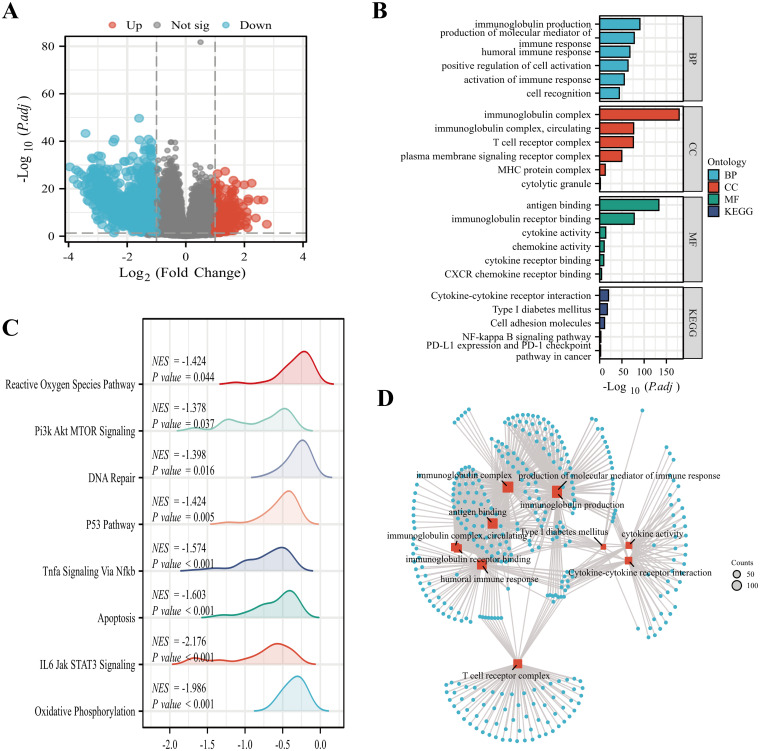
Figure 5.
Functional enrichment analyses of SOX13-associated DEGs in THCA. (A) Volcano plot showing differential expression of SOX13high and SOX13low genes. (B) GO and KEGG analyses of SOX13-associated DEGs. (C) Analysis of the most significantly enriched networks between elevated SOX13 and reduced SOX13 samples using GSEA. (D) GO and KEGG analyses of SOX13-associated DEGs. *p<0.05; **p<0.01; ***p<0.001; ****p<0.0001. NS, not significant.

