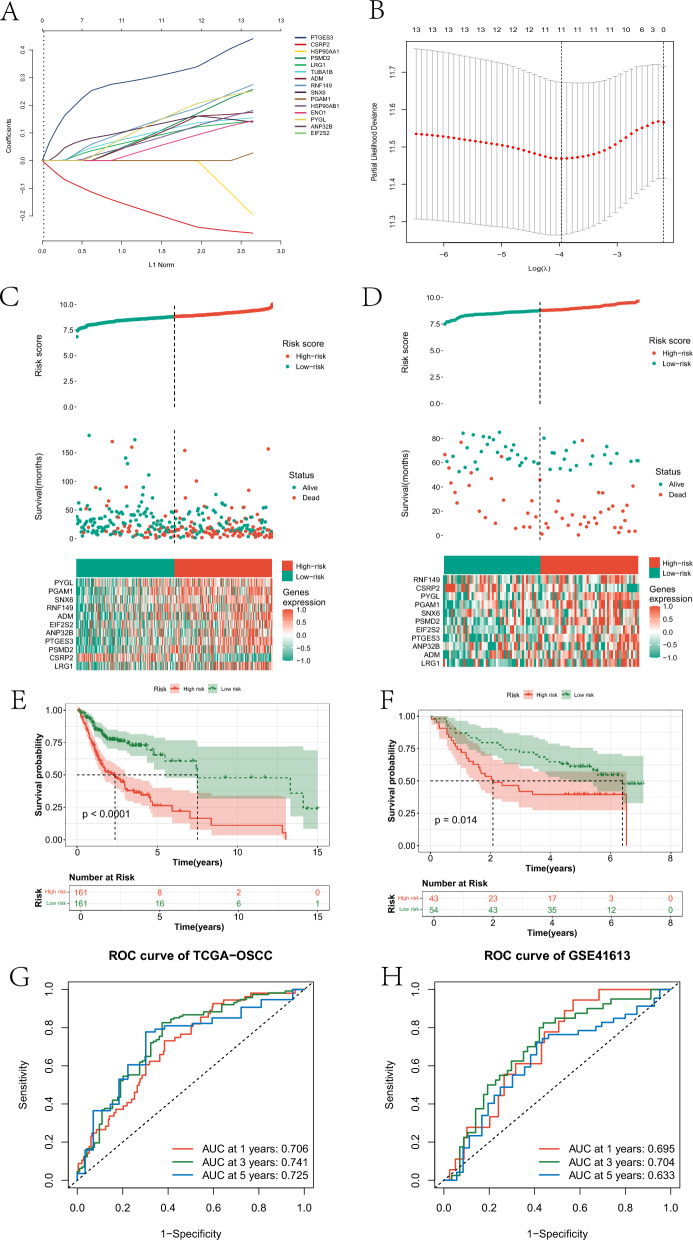
Fig. 5.
The process of constructing the prognostic model based on Lasso-Cox. A and B represent the genes determined by Lasso regression analysis to participate in building the risk model and their corresponding coefficients. C and D represent the risk score distribution curves, risk score scatter plots, and the heatmap of gene expression involved in constructing the risk model for the high-risk and low-risk groups in the training and testing cohorts, respectively. E and F represent the KM survival curves of high and low-risk groups in the training and test sets, respectively. G and H respectively depict the ROC curves of the risk model predicting 1-year, 3-year, and 5-year survival rates of OSCC patients in the training and test sets

