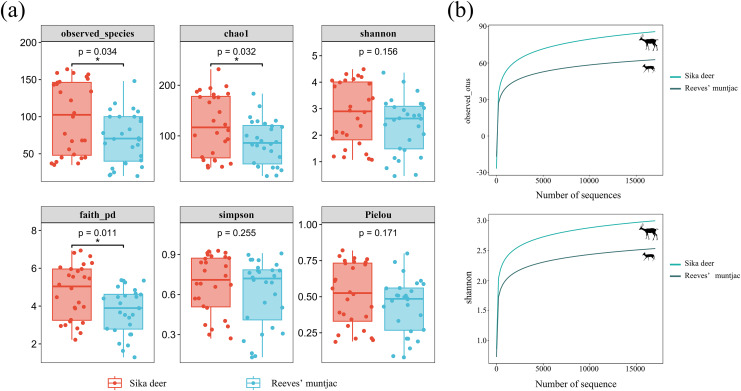
Figure 3. (A) Box-plot of the alpha diversity index using Kruskal-Wallis and Wilcox tests. In each panel, the abscissa is the group, and the ordinate is the value of the corresponding alpha diversity index. (B) Alpha rarefaction curves: Observed species index and Shannon index.
*Significant different between groups (p < 0.05).

