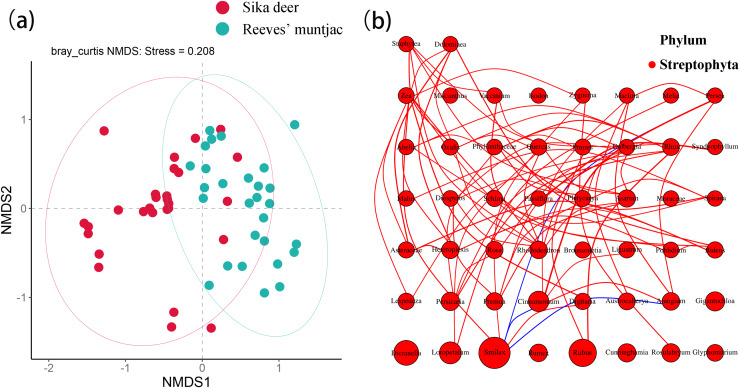
Figure 7. (A) NMDS analysis of sika deer and Reeves’ muntjac with 95% confidence ellipse. (B) Network analysis of forage plants.
The size of the circles represents relative abundance, the lines indicate a significant correlation between two species (p < 0.05). Red lines mean positive correlations and blue means negative correlations.

