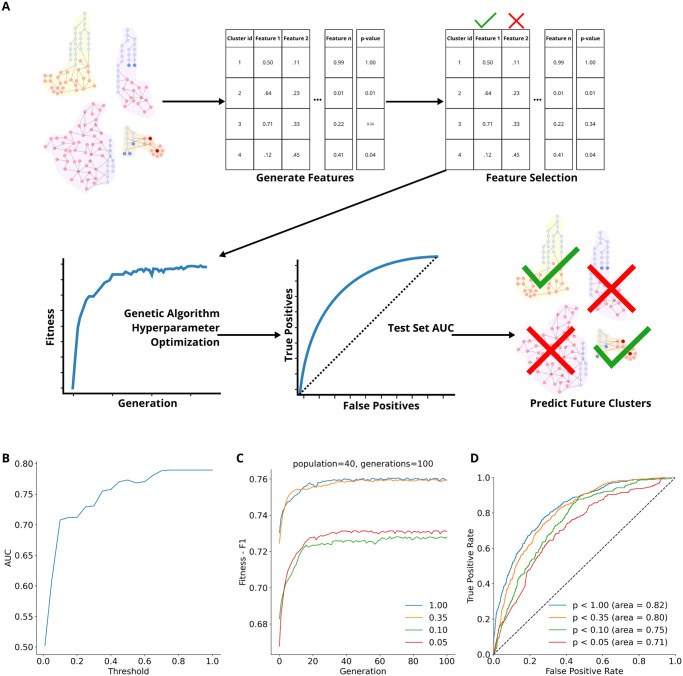
Fig 4.
A. Procedure for training and evaluating the XGboost model. Features were generated about each cluster (identified as described in Section) describing them with a series of biological and network topological features, following which feature selection was performed. Hyperparameters were tuned using a genetic optimization algorithm. Final trained models are evaluated on a held-out test set. Models were then used to make predictions about clusters from the most up-to-date version of the network. B. AUC model performance as a function of p-value threshold. For each value across the x-axis, we trained a model to predict p < threshold and reported the validation set AUC of that experiment on the y-axis. Hyperparameters used in this analysis were those originally established for p < 1.00. All models were trained on the 2019 clusters and validation was done on the 2020 clusters. Notice that the AUC has inflection points, and stops its origin rapid increase, at p = 0.10 (AUC = 0.71) and p = 0.35 (AUC = 0.76) achieving performance similar to p < 1.00 (AUC = 0.79) despite being substantially more stringent. C. Change in fitness (F1 score) as the genetic algorithm optimizer progressed. D. Hold out test set ROC curves for the models trained to predict the four different thresholds of significance. The dashed black line marks a line with a slope of 1 and AUC = 0.50.

