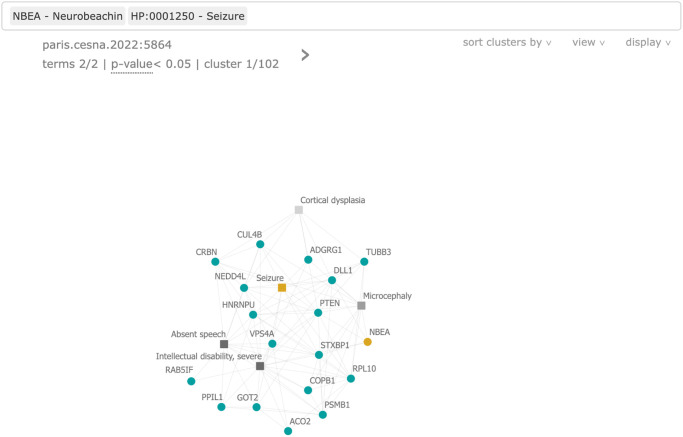
Fig 5. Screenshot from the BOCC visualization web app.
An example is shown for MyGene2 patient 1930, searching for one of their affected genes NBEA and the HPO term Seizures (HP:0001250), both highlighted as the only yellow nodes. Phenotype terms are shown as square nodes and genes as circles. The darkness of the phenotype terms is indicative of the depth of the term on the HPO tree—a proxy for how specific the term is. NBEA and Seizures have no direct connection between them, however, they co-occur in a cluster that the p < 0.05 model predicted to contain a significant number of discoveries in the near future. In this cluster, they share numerous neighbors that are fairly densely connected to each other.

