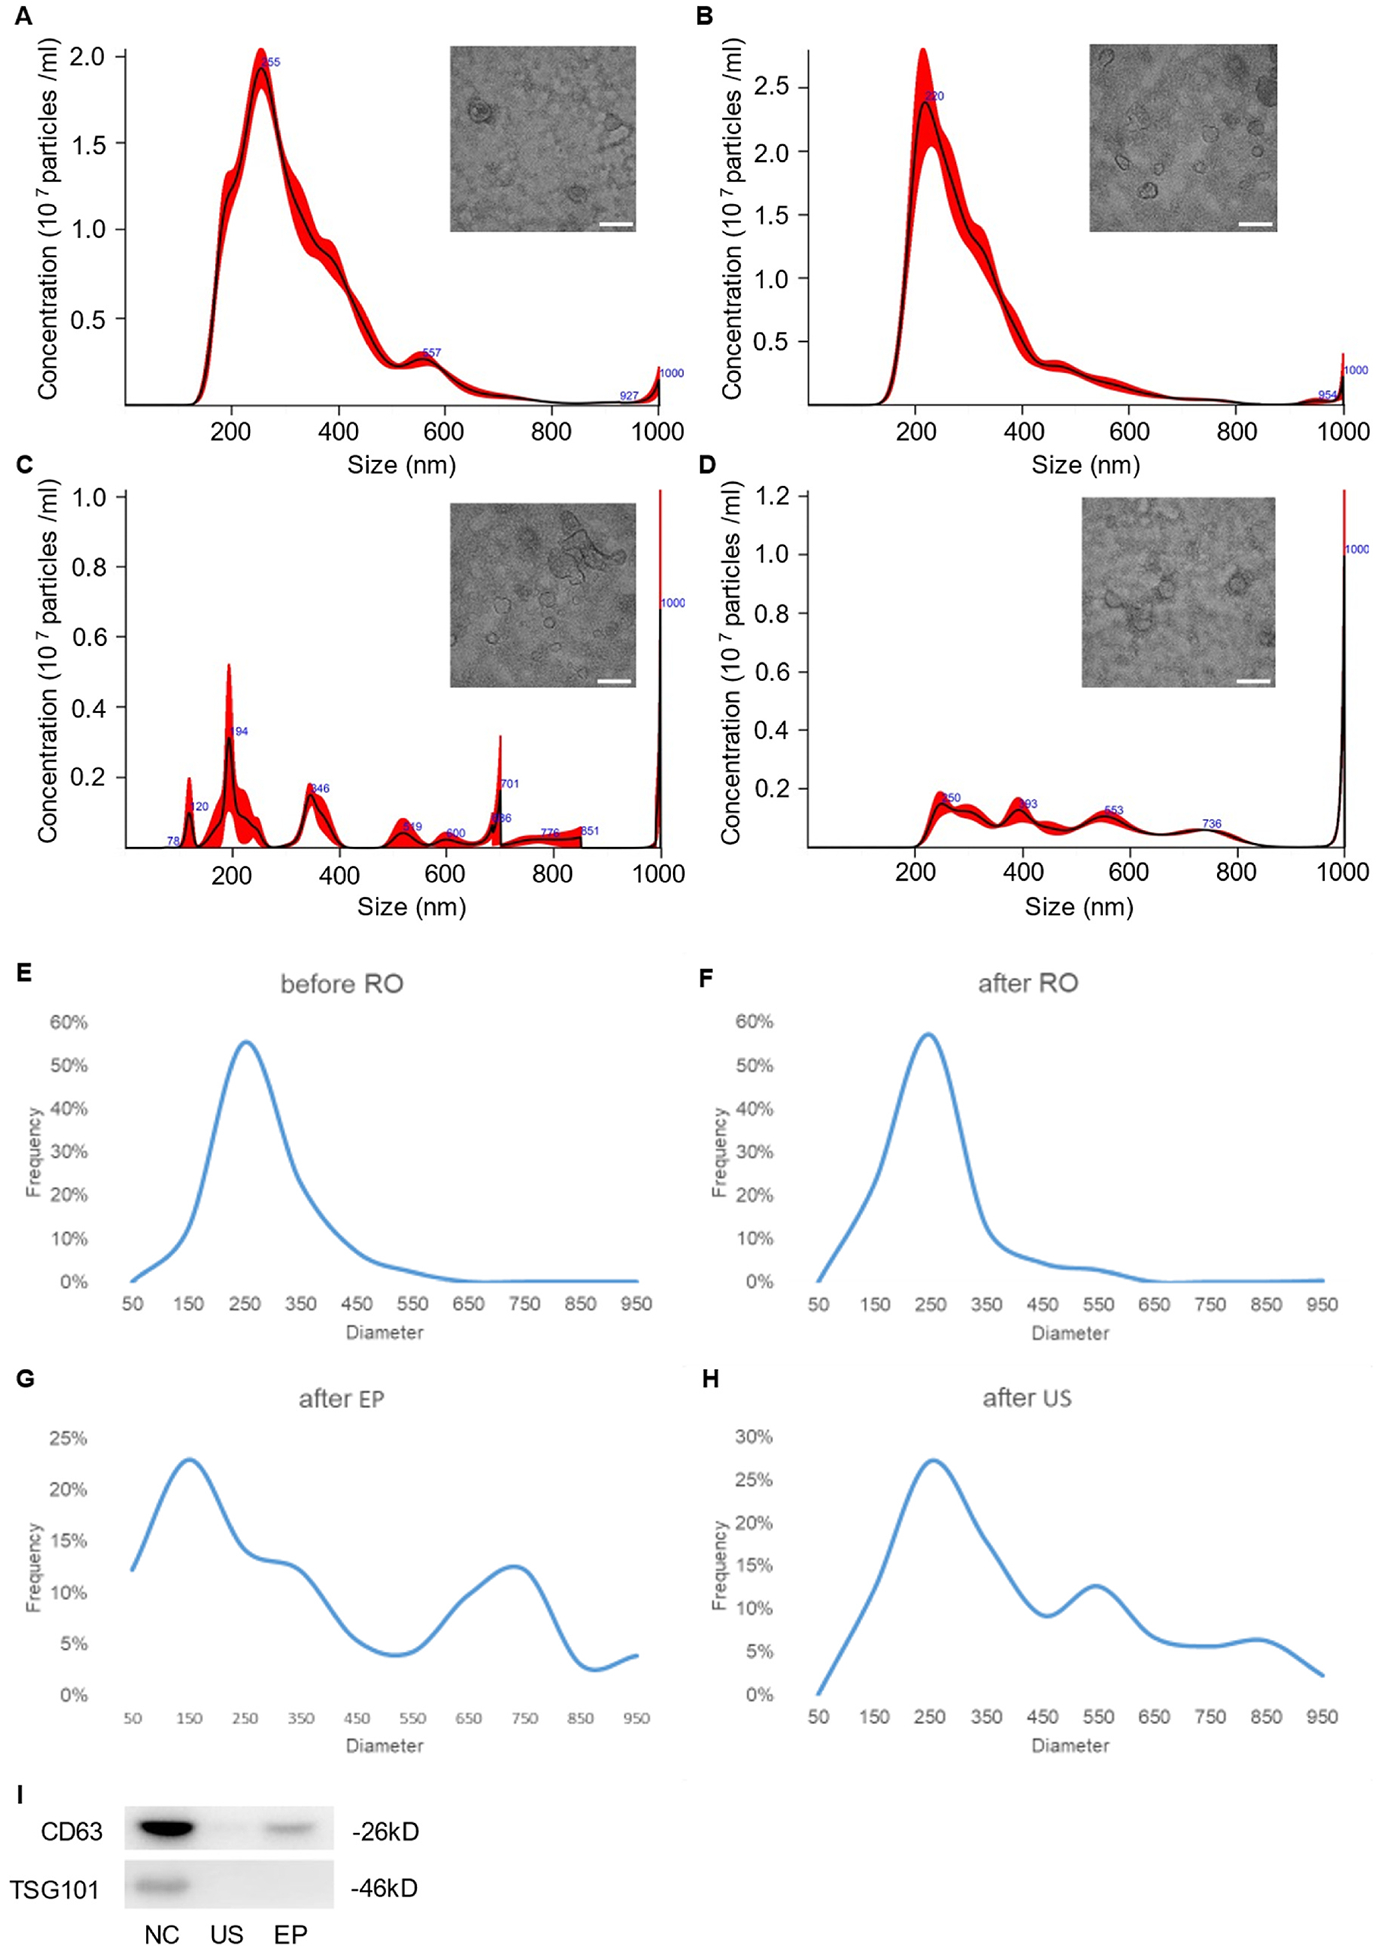
Fig. 1. Characterization of EVs.

(A) Size distribution and TEM image of EVs before RO. (B) Size distribution and TEM image of EVs after RO. (C) Size distribution and TEM image of EVs after EP. (D) Size distribution and TEM image of EVs after US. Scale bars in A-C is 100 nm. (E) Size distribution based on TEM before RO. (F) Size distribution based on TEM after RO. (G) Size distribution based on TEM after EP. (H) Size distribution based on TEM after US. (I) Western blot analysis of CD63 and TSG101 from NC, US, and EP groups, respectively.
