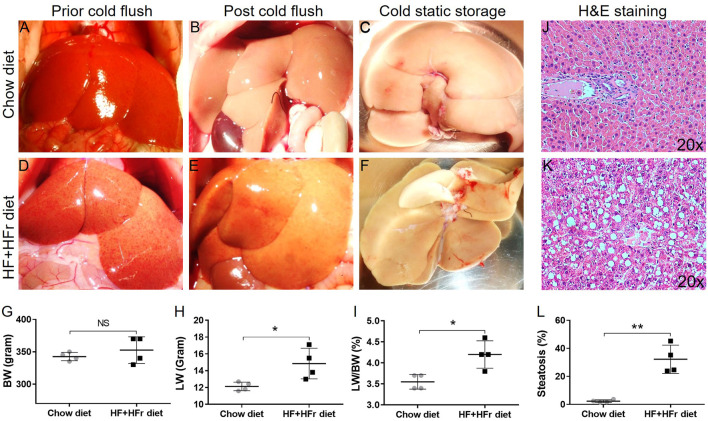
FIGURE 2.
Macroscopic and microscopic features of rat liver allografts fed with chow and HF + HFr diets. The gross appearance of lean (A–C) and steatotic (D–F) rat liver allografts prior, post-HTK perfusion, and in cold storage. The body weight [BW, (G)], liver weight [LW, (H)], and LW/BW ratio (I) of lean and steatotic groups. The H&E staining images (×20) of lean (J) and fatty (K) rat liver allografts and quantitative analyses of steatosis [(L), n = 4 per group; *p < 0.05 or **p < 0.01, t-Test].

