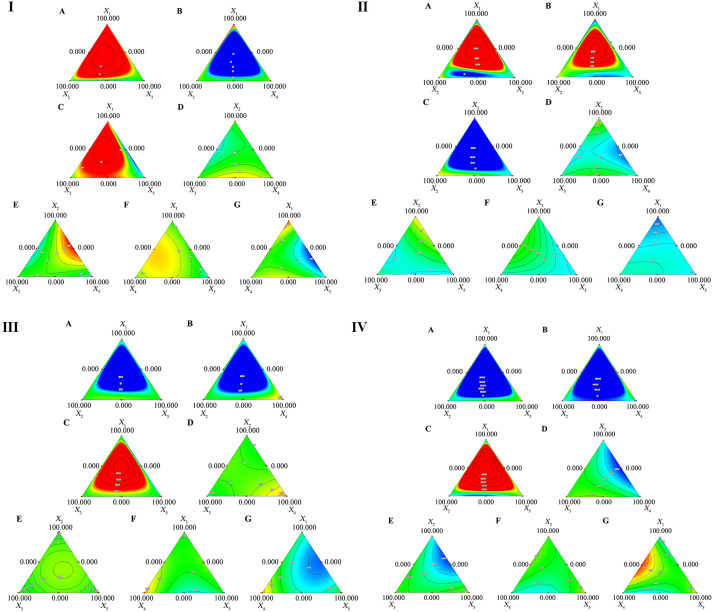
Figure 2.
Contour map. I: Contour Figure (I-A) shows the effect of the interaction between various main ingredients on mycelial growth rate: the interaction among rice straw, soybean straw, and cob; (I-B): The interaction between rice straw, soybean straw, and peanut straw; (I-C): The interaction between rice straw, peanut straw, and rapeseed straw; (I-D): The interaction between soybean straw, cob, and peanut straw; (I-E): The interaction between soybean straw, cob straw, and rapeseed straw; (I-F): The interaction between cob, peanut straw, and rapeseed straw; (I-G): The interaction between rice straw, peanut straw, and rapeseed straw. II: Contour Figure (II-A): The interaction between rice straw, soybean straw, and cob; (II-B): The interaction between rice straw, soybean straw, and peanut straw; (II-C): The interaction between rice straw, peanut straw, and rapeseed straw; (II-D): Interaction between soybean straw, cob, and peanut straw; (II-E): The interaction between soybean straw, cob straw, and rapeseed straw; (II-F): The interaction between cob, peanut straw, and rapeseed straw; (II-G): The interaction between rice straw, peanut straw, and rapeseed straw. III: Contour Figure (III-A): The interaction between rice straw, soybean straw, and cob; (III-B): Interaction between rice straw, soybean straw, and peanut straw; (III-C): Interaction among rice straw, peanut straw, and rapeseed straw; (III-D): Interaction among soybean straw, cob, and peanut straw; (III-E): Interaction among soybean straw, cob straw, and rapeseed straw; (III-F): Interaction among cob, peanut straw, and rapeseed straw; (III-G): The interaction between rice straw, peanut straw, and rapeseed straw. IV: Contour (IV-A): The interaction between rice straw, soybean straw, and cob; (IV-B): The interaction between rice straw, soybean straw, and peanut straw; (IV-C): The interaction between rice straw, peanut straw, and rapeseed straw; (IV-D): Interaction between soybean straw, cob, and peanut straw; (IV-E): The interaction between soybean straw, cob straw, and rapeseed straw; (IV-F): The interaction between cob, peanut straw, and rapeseed straw; (IV-G): The interaction between rice straw, peanut straw, and rapeseed straw. The closer the color of the contour map is to red, the higher the numerical value and the contribution rate; the closer it is to blue, the lower the numerical value and the contribution rate).

