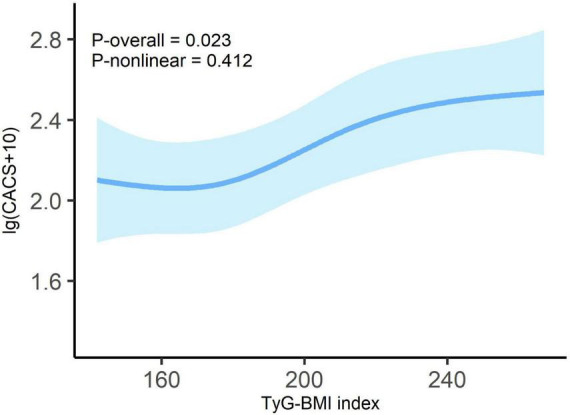
FIGURE 2.

Dose-response relationship between TyG-BMI index and lg (CACS + 10) in overall patients. Adjusted for age; sex; tobacco use; alcohol consumption; diabetes; hypertension; duration of dialysis; diastolic blood pressure; pulse pressure; fasting blood glucose; high-density lipoprotein cholesterol; hemoglobin; albumin and C-reactive protein. Odds ratios are indicated by solid lines and 95% CIs by shaded areas.
