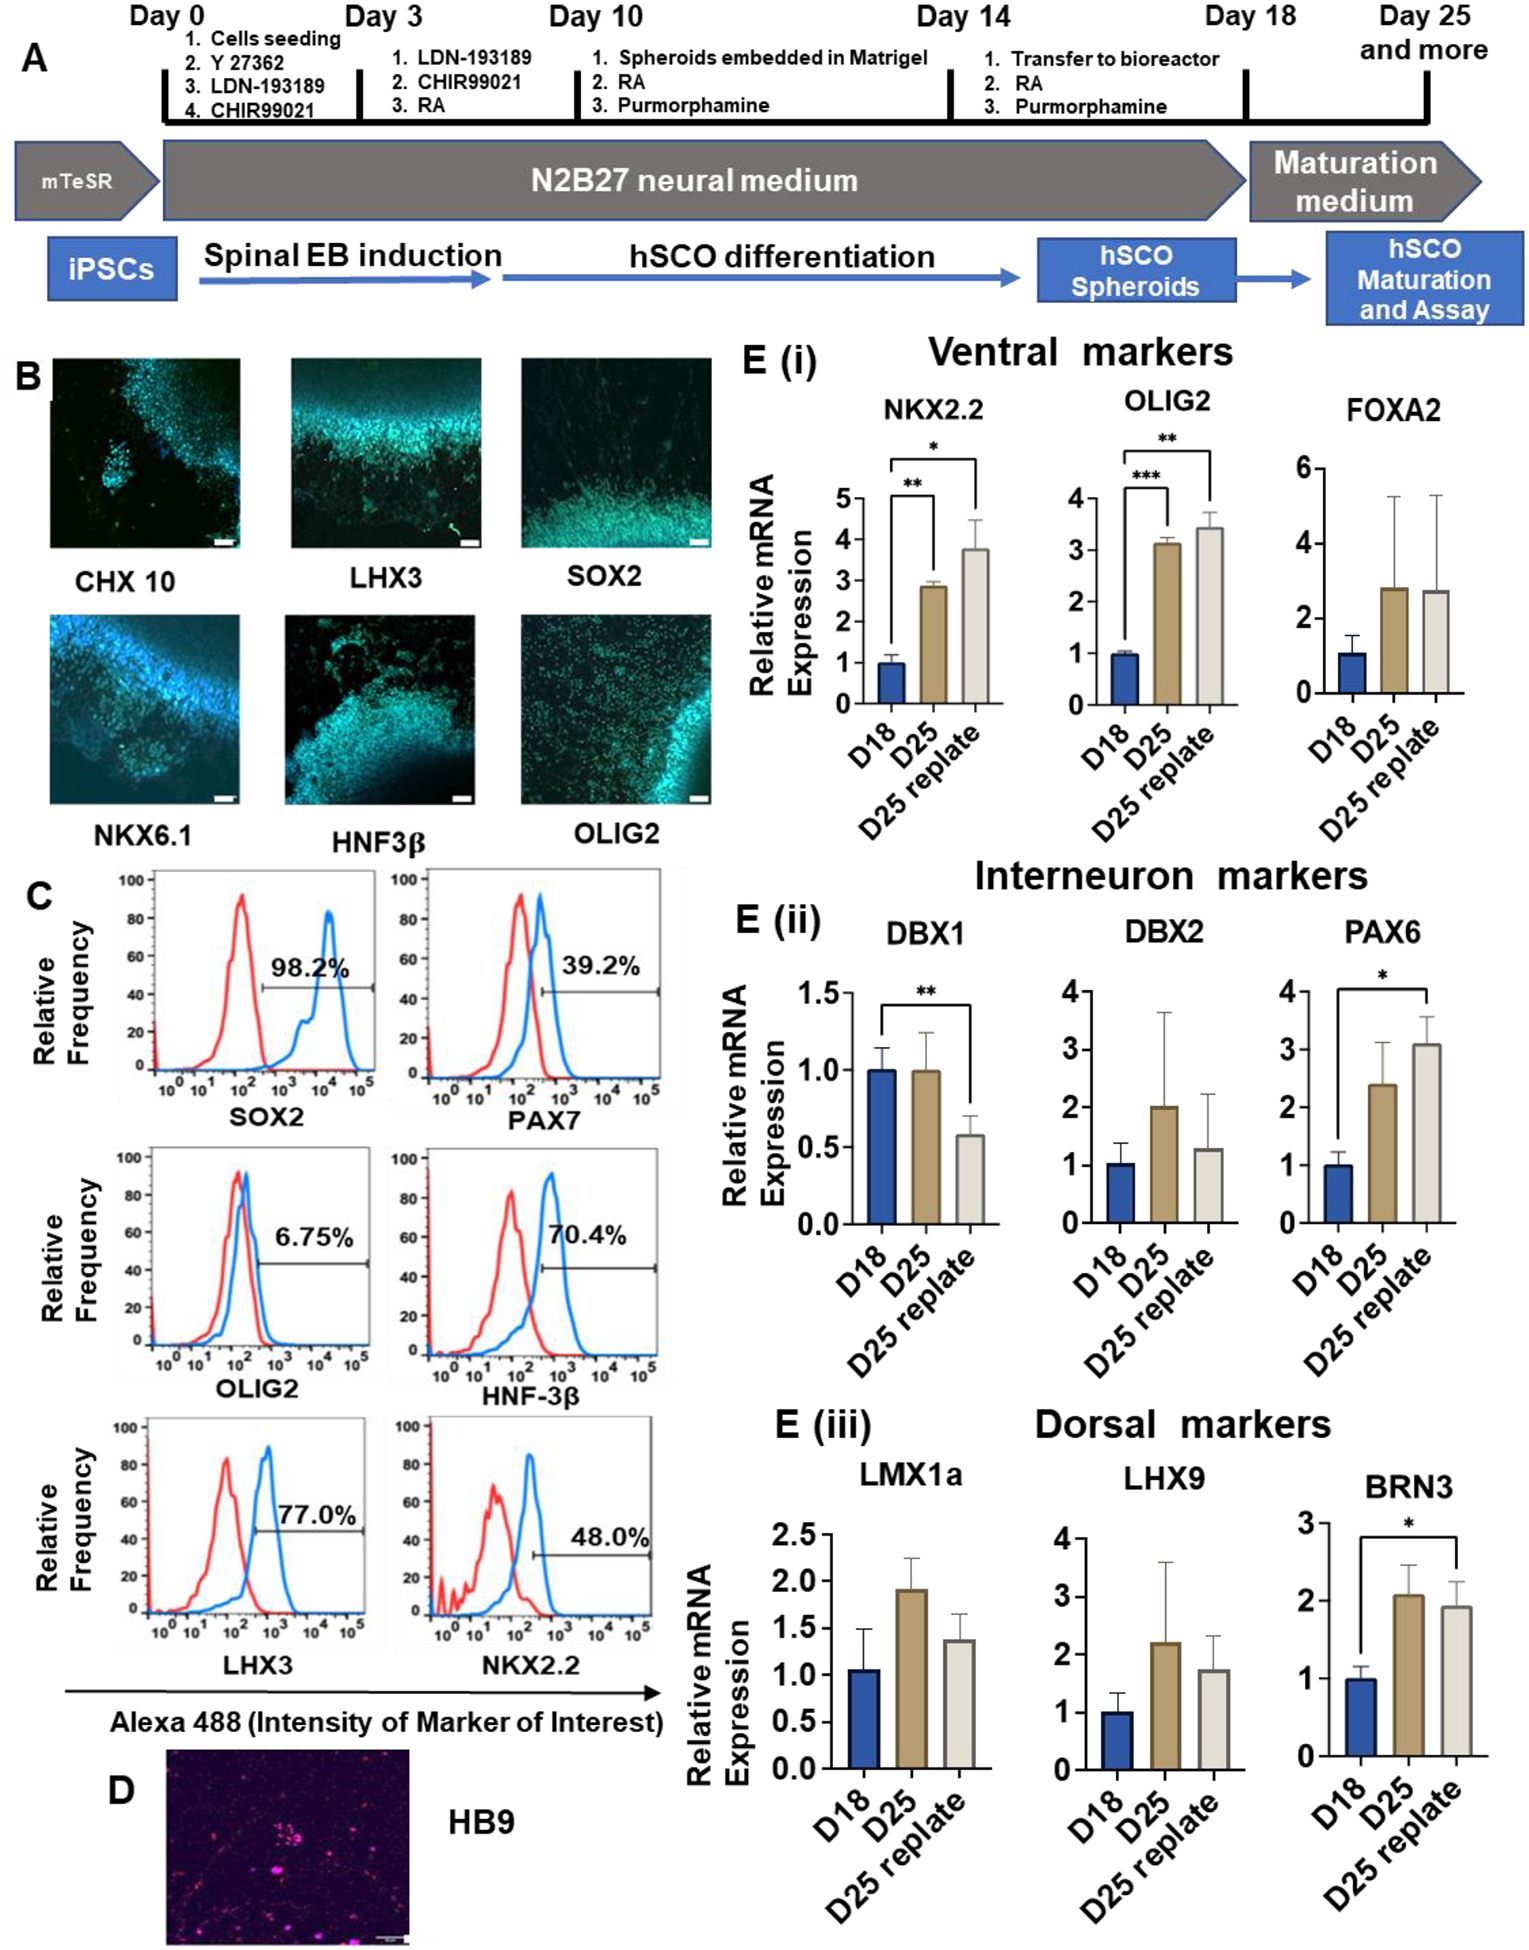
Figure 2. Ventral hSCO differentiation and characterization.

(A) Schematic illustration of ventral hSCO differentiation protocol. (B, C, D) Immunostaining and flow cytometry analysis for marker expression of hSCO differentiation. (B) and (D) were taken using confocal microscopy. Scale bar = 50 μm. (E) Quantitative RT-PCR for relative mRNA expression of various spinal cord markers after biochemical induction (n=3). (i) Ventral markers; (ii) Interneuron markers; (iii) Dorsal markers. * indicates p≤0.05, **: p≤0.01, ***: p≤0.001.
