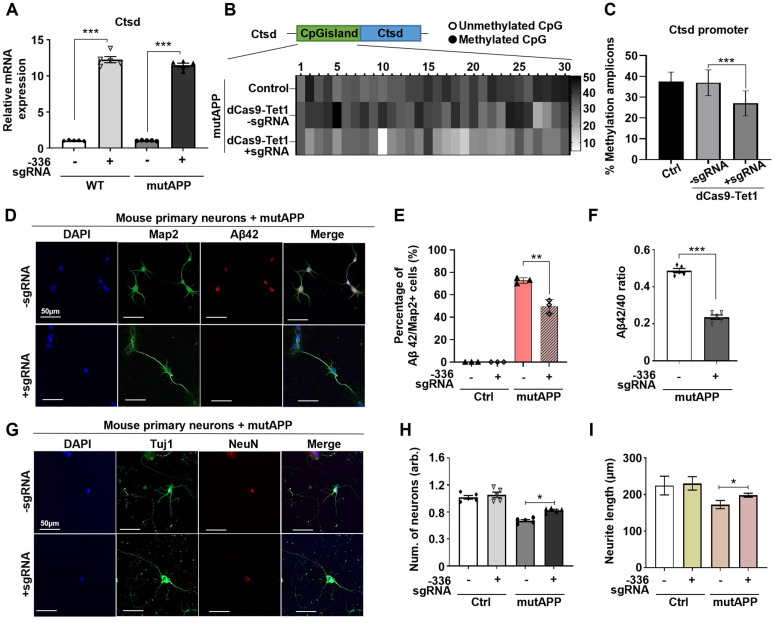
Figure 2.
dCas9-Tet1-mediated demethylation of Ctsd reduced Aβ42 production in mutAPP mouse primary neurons. (A) Quantitative real-time PCR analysis of Ctsd expression in primary neurons from WT and mutAPP mice treated with -336 sgRNA and dCas9-Tet1. Data are shown as mean ± SEM (n = 5). *** p < 0.001, two-tailed unpaired t-tests. (B) Bisulfite sequencing analysis of the Ctsd promoter region in mutAPP mouse primary neurons treated with -336 sgRNA and dCas9-Tet1. (C) Quantification of demethylated amplicons. A total of 10 to 30 sequences were analyzed across three independent experiments. Data are expressed as mean ± SEM. *** p < 0.001, one-way ANOVA with Tukey's multiple comparisons test. (D) Immunostaining for Map2 (green), Aβ42 (red), and DAPI (blue) in mutAPP mouse primary neurons treated with -336 sgRNA and dCas9-Tet1. (E) Quantification of Aβ42+/Map2+ cell counts from panel D. More than 100 neurites were measured across three independent experiments. Data are presented as mean ± SEM (n = 5). **p < 0.01, two-way ANOVA with Tukey's multiple comparisons test. (F) ELISA assessment of the Aβ42/Aβ40 ratio in mutAPP mouse primary neurons transduced with -336 sgRNA and dCas9-Tet1. Data are expressed as mean ± SEM (n = 5). ***p < 0.0001, two-tailed unpaired t-tests. (G) Immunostaining for Tuj1 (green), NeuN (red), and DAPI (blue) in mutAPP mouse primary neurons treated with -336 sgRNA and dCas9-Tet1. (H) Quantification of Tuj1-positive neurons from panel G. Data are shown as mean ± SEM (n = 5). *p < 0.05, two-tailed unpaired t-tests. (I) Quantification of neurite length from panel G. More than 100 neurites were measured across three independent experiments. Data are expressed as mean ± SEM. *p < 0.05, two-tailed unpaired t-tests. Images in panels B, D, and G are representative of three or more similar experiments.

