Figure 5.

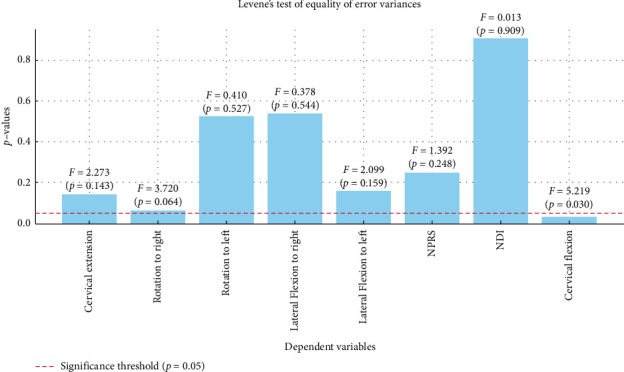
Visually illustrates the results of Levene's test for equality of error variances across various dependent variables. The p values for each variable are displayed, with a red dashed line indicating the significance threshold of p=0.05.

Visually illustrates the results of Levene's test for equality of error variances across various dependent variables. The p values for each variable are displayed, with a red dashed line indicating the significance threshold of p=0.05.