Figure 3.

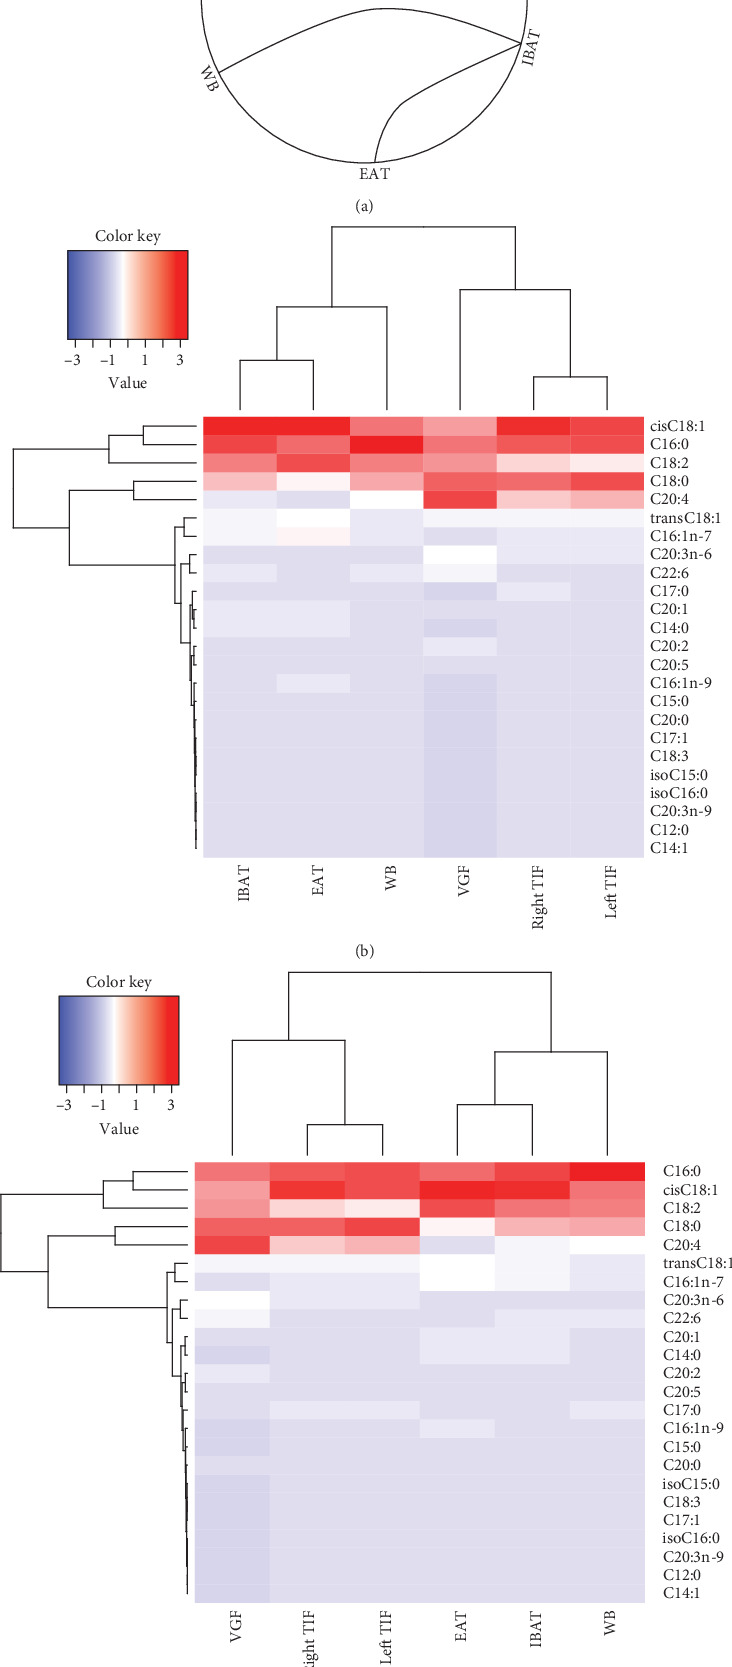
Multitissue comparison of FA profiles. (a) Circos graph of paired comparisons across tissues. Solid curved lines connect tissues with nonsignificantly different FA profiles (chi-square test). (b, c) Heat maps of individual FA levels (listed on the right-hand side of the heat map) across the analyzed tissues (listed below the heat map) in control (b) or AA-supplemented (c) mice. The left-to-right order of tissues in (b, c) is as rendered by the R software. n = 10/group, except n = 9 in AA-supplemented IBAT. EAT, epididymal adipose tissue. IBAT, interscapular brown adipose tissue. TIF, testicular interstitial fluid. VGF, vesicular gland fluid. WB, whole blood.
