
FIGURE 1.
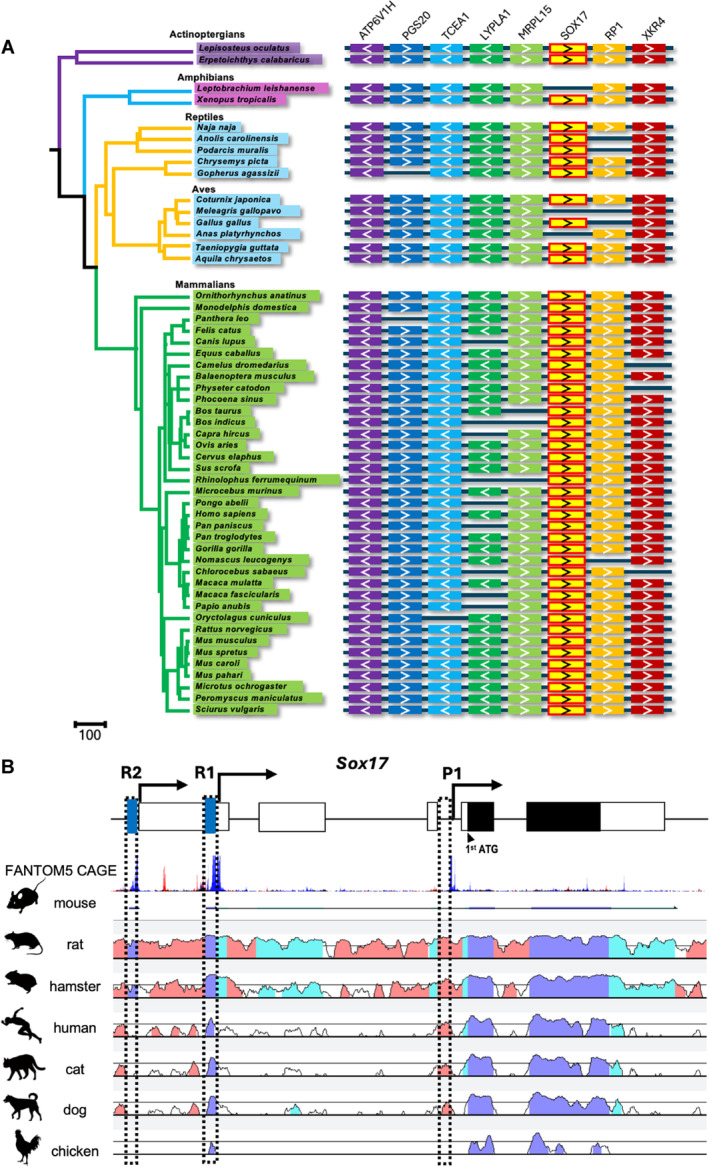
Conservation analysis of Sox17. (A) Sox17 synteny conservation in vertebrates. Genes are depicted by colored boxes with an arrow. (B) FANTOM5 CAGE analysis of mouse Sox17 and VISTA plots compared with other vertebrate orthologous regions. White box: Exons; black box: Protein‐coding regions. The dashed boxes of the putative regulatory sequences R1 and R2, as well as the reported promoter P1, are close to the TSS marked in FANTOM5 CAGE. Blue peaks: Total counts of CAGE read forward; red peaks: Total counts of CAGE read reverse; dark blue: Exons; light blue: UTRs; pink: Non‐coding regions.