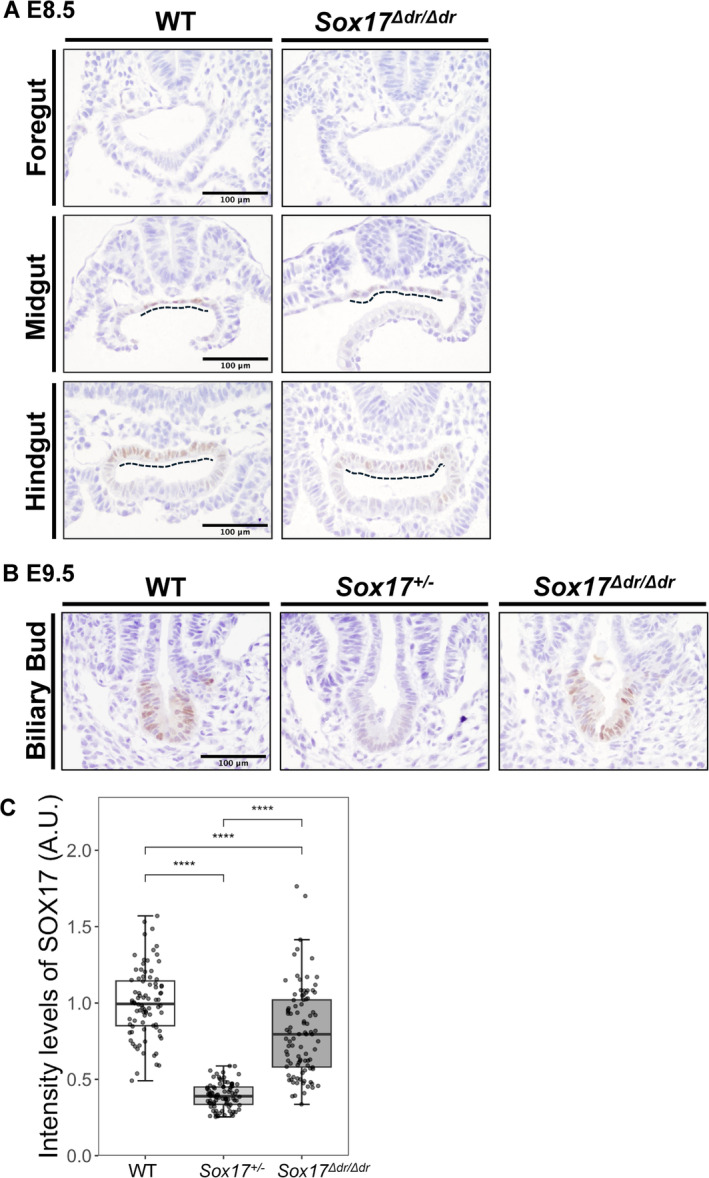
FIGURE 3.

SOX17 expression in E8.5 and E9.5 Sox17Δ dr/Δdr mice. (A) Immunostaining of foregut, midgut and hindgut from WT and Sox17 Δdr/Δdr mice at E8.5. The dashed line indicates SOX17 expression in the endoderm. Scale bars: 100 μm. (B) Immunostaining of the biliary duct from WT, Sox17 +/− and Sox17 Δdr/Δdr mice at E9.5. Scale bars: 100 μm. (C) Semiquantitative analysis of the intensity of SOX17 staining in the gallbladders at E9.5 of WT, Sox17 +/− and Sox17 Δdr/Δdr . n = 4 for each group. The staining intensities were normalized to the average staining intensity of WT. ****: p < 0.0001.
