. 2024 Jul 20;79(12):e221168. doi: 10.1136/thorax-2023-221168

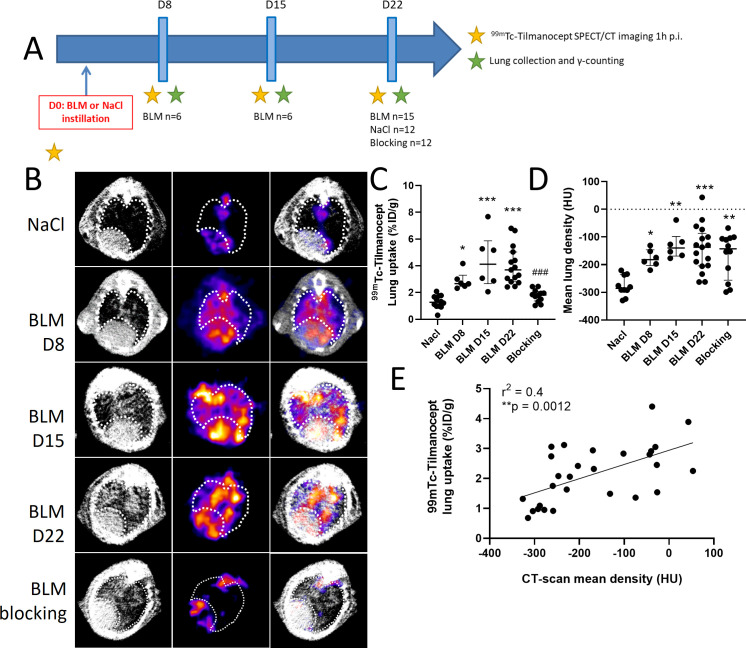
Figure 3. 99mTc-tilmanocept is able to detect advanced bleomycin (BLM)-induced lung fibrosis. (A) Schematic representation of the design of the study of 99mTc-tilmanocept imaging in NaCl- and BLM-receiving mice at several stage of experimental fibrosis. (B) Representative lung single photon emission computed tomography/CT (SPECT/CT) images with 99mTc-tilmanocept of NaCl- and BLM-receiving mice at D8, D15 and D22 (the lung region is represented by the dotted circle). (C) Graph represents the 99mTc-tilmanocept lung uptake in %ID/g of NaCl- and BLM-receiving mice at D8, D15 and D22. Results are presented as median±IQR, NaCl n=12, BLM D8 n=6, BLM D15 n=6, BLM D22 n=15. Star (*) is a representative of comparison of each group with the NaCl group and hash (#) is a representative of statistical comparison of blocking group with the BLM D22 group. The difference between groups was compared using Kruskal-Wallis non-parametric analysis of variance (ANOVA), *p<0.05, ***(###)p<0.001. (D) Graph represents the mean lung density quantified on CT images of NaCl- and BLM-receiving mice at D8, D15 and D22. Results are presented as median±IQR, NaCl n=12, BLM D8 n=6, BLM D15 n=6, BLM D22 n=15. The difference between groups was compared using Kruskal-Wallis non-parametric ANOVA. *p<0.05, **p<0.01, ***p<0.001. (E) Correlation between mean lung densities (HU) measured on CT images and 99mTc-tilmanocept lung uptake (%ID/g) of the corresponding lungs measured on SPECT/CT.

Figure 3