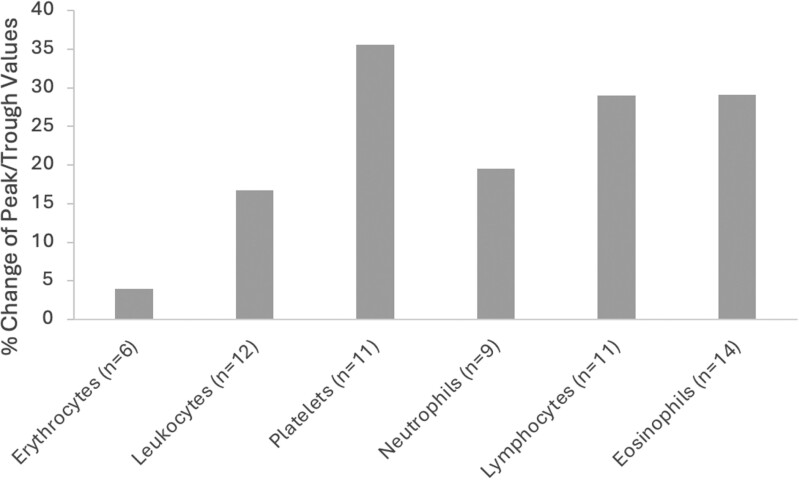
Figure 3.
Bar graph showing the percent change in peak and trough differences for various components of a complete blood count (CBC) across 30 studies. The percent change is calculated as the difference between peak and trough values, divided by the peak value. The components include erythrocytes (3.94% change), leukocytes (16.77% change), platelets (35.56% change), neutrophils (19.48% change), lymphocytes (28.96% change), and eosinophils (29.13% change). Platelets show the highest percent change, followed by eosinophils and lymphocytes. Erythrocytes exhibit the smallest percent change.

