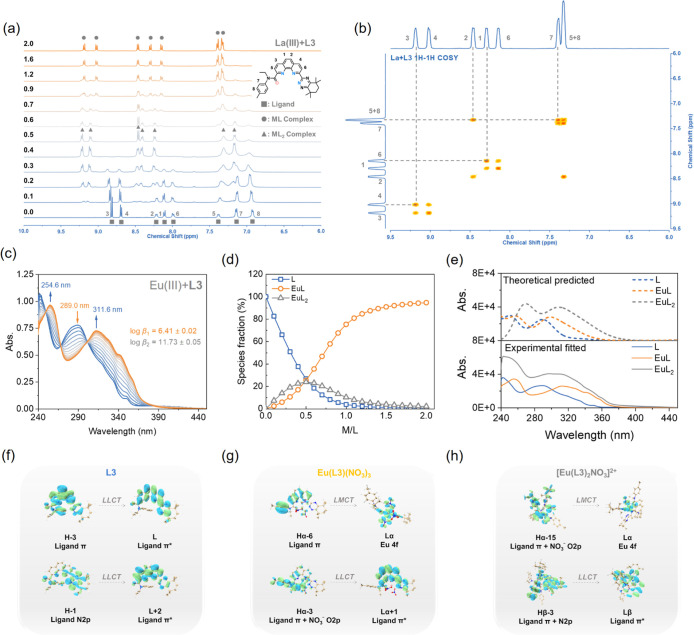
Figure 5.
(a) Stacked 1H NMR titration spectra of La(III) and L3 (■ = ligand peaks; ● = 1:1 complex peaks; ▲ = 1:2 complex peaks); (b) 1H–1H COSY NMR spectra of La(III) and the L3 complex; (c) UV–vis spectra; (d) species fraction with increasing equivalents of Eu(III) with L3 during UV–vis spectroscopic titration; (e) TDDFT/PBE0 simulated and experimental UV–vis spectra of L3, Eu(L3)(NO3)3, and [Eu(L3)2NO3]2+. The calculated spectra were blue-shifted by 2229 cm–1 to align with the experimental spectra. (f) L3, (g) Eu(L3)(NO3)3, and (h) [Eu(L3)2NO3]2+ associated with electronic transitions.

