
Figure 4.
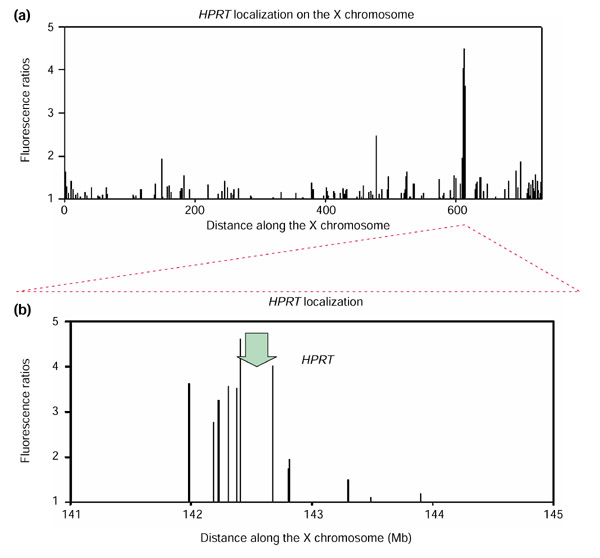
Resolution of the array-CGH mapping method. (a) For the microarray comparison between the complemented HPRT-deficient CHO-human radiation hybrid cell DNA versus wild-type CHO DNA, fluorescence ratios are depicted for chromosomal region Xq24-Xqter. In this depiction, non-averaged fluorescence ratios are plotted; therefore, amplitudes reflect actual measured fluorescence ratios for each gene/EST (log10 scale). A sharp maximum of fluorescence ratios is observed in the region surrounding the HPRT locus on the human X chromosome, indicating the retention, and therefore the gain, of DNA copy number for genes in this region. The units for the distance along the X chromosome are units for radiation hybrid distances (cR3000) as defined in [5]. (b) Close-up depiction of the fluorescence ratio peak observed around the HPRT locus on the human X chromosome. The peak region covers approximately 900,000 base pairs. Gene/EST array elements around the HPRT locus (indicated by the green arrow) are located according to their genomic positions, and fluorescence ratios are depicted on a log10 scale.