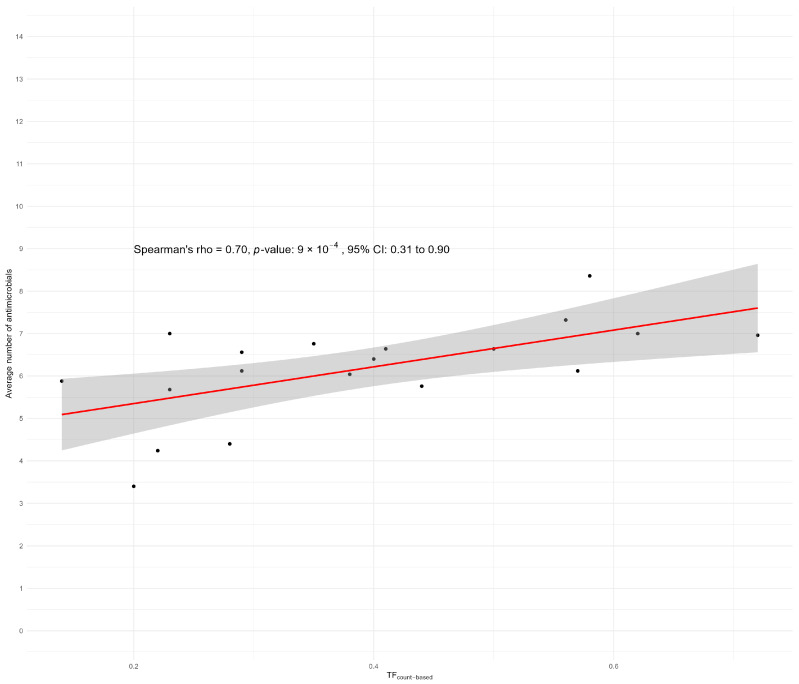
Figure 5.
A scatterplot of the Spearman correlation between the AMU in average treatment days per production cycle in relation to the average number of antimicrobials to which isolates tested as resistant according to the CBPs. Because no CLSI CBP for tigecycline was available, the EUCAST CBP was used for tigecycline.

