
Figure 3.
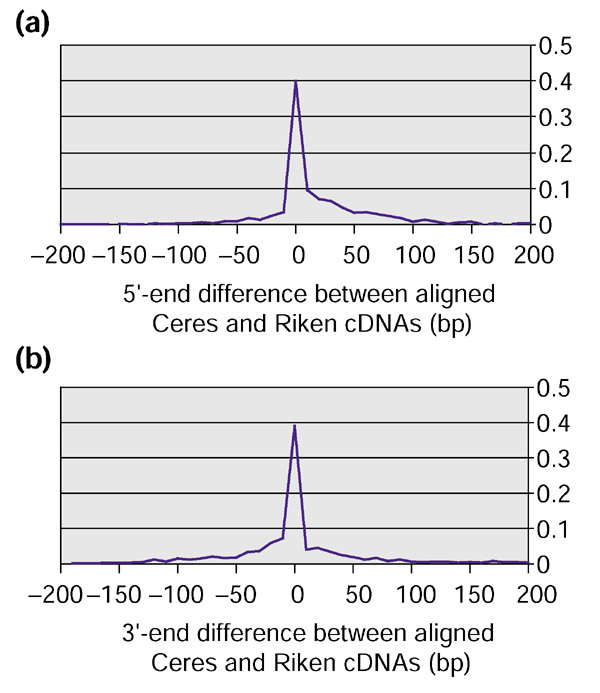
Comparison of the lengths of the 941 cDNAs from the clones that are contained in both the Ceres and RIKEN collections. (a) Comparison of the 5'-end difference between Ceres and RIKEN clones; (b) comparison of the 3'-end difference between Ceres and RIKEN clones. Peak height indicates the percentage of sequences with a length difference as indicated along the horizontal axis. Positive values on the horizontal axis correspond to longer Ceres clones, while negative values correspond to longer RIKEN clones.