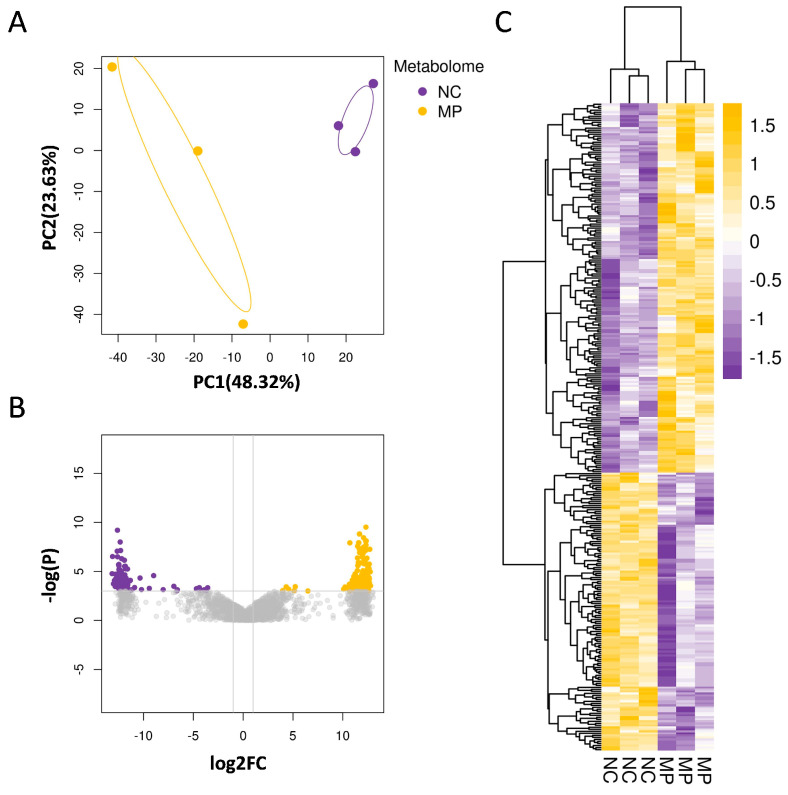
Figure 4.
Prenatal exposure to PS-MPs altered the aqueous metabolite composition of offspring lung tissue. (A) The PCA displays the expression of aqueous metabolites in the control group (NC) and the prenatal polystyrene microplastics (PS-MPs) exposure group (MP). The yellow and purple dots represent three samples from the control group and the PS-MPs group, respectively. (B) The volcano plot demonstrates the differential expression of aqueous metabolites between the MPs and control groups. In this study, differential expression analysis of aqueous metabolites was performed, and a threshold of p < 0.05 and |fold change| ≥ 2 was used to identify significant differential metabolites. In the plot, the horizontal axis represents the fold change, while the vertical axis represents the adjusted p-value, with smaller values indicating more significant differences. Higher −log10 values correspond to higher statistical significance. (C) The heatmap shows the differential aqueous metabolites between the MPs group and control group. Increased aqueous metabolites were represented in yellow, and decreased aqueous metabolites were represented in purple, compared to the control group. Each group comprised three animals.

