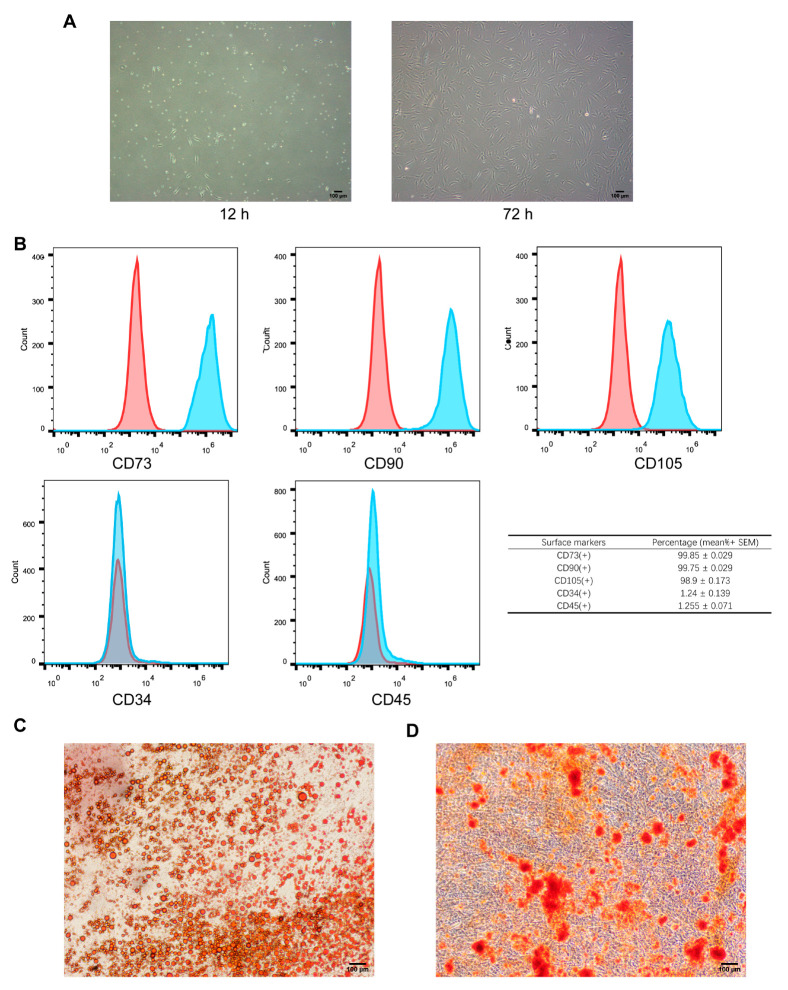
Figure 2.
Identification of ADSCs. (A) A Morphology of human ADSCs at 12 h and 72 h; scale bar: 100 μm. (B) Flow cytometry detection of ADSCs. ADSCs were positive for the markers CD73, CD90, and CD105 (blue peaks) and negative for the markers CD34 and CD45 (red peaks). The table summarizes the percentage of cells expressing each marker (mean ± SEM). (C) ADSC lipogenicity assay; scale bar: 100 μm. (D) ADSC osteogenicity assay; scale bar: 100 μm.

