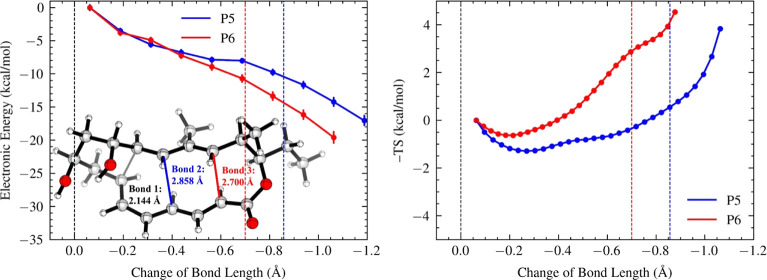
Figure 5.
Energy (left) and entropy (right) profiles, alongside the ambimodal TSS of the NgnD-catalyzed Diels–Alder reaction. Bond 2 formation leads to the [4 + 2] adduct P5 (blue), and bond 3 formation leads to the [6 + 4] adduct P6 (red). The x-axes show changes in bond lengths from the ambimodal TSS, with blue and red dashed lines indicating 2.0 Å. The energy and entropy values for each structural window are computed with reference to those of the first post-TS points. Error bars on energy and entropy profiles represent the standard error of the mean.

