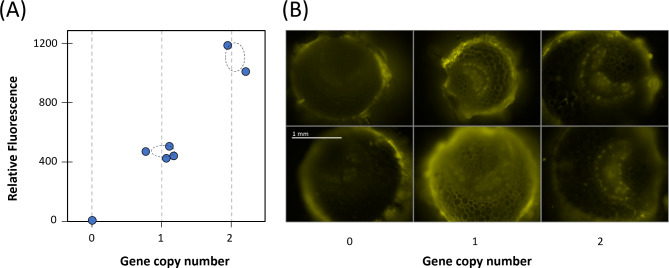
Fig. 5.
Segregation of hemizygous transgenics for the apoplastically expressed (Ly60) and phloem-targeted (Ly62) expression of mCherry. (A) Protein extract fluorescence as basis of confirming mCherry expression and transgene segregation from T2 segregants from a T1 hemizygous single gene copy insertion for Ly60; fluorescence (ex. 585 nm, em. 620 nm; 96-well plate) plotted against dPCR gene copy number with confidence interval (STD) dashed ovals and (B) Images of Ly62 with confocal microscopy (1/20 s exposures, Cy3 filter set) aligned by gene copy number. All images taken at the same magnification

