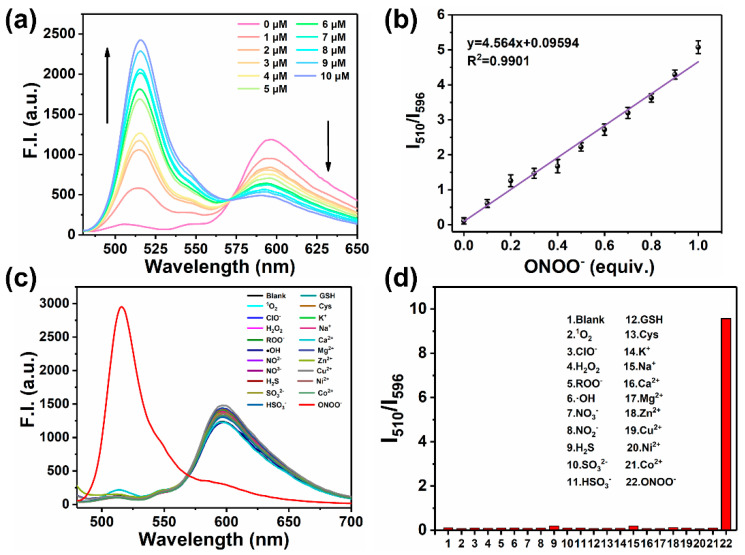
Figure 2.
(a) Fluorescence spectra of MOBDP-I (10 μM) in response to ONOO− (0~10 μΜ) in PBS (pH = 7.4), λex = 460 nm. (b) Linear relationship between the fluorescence intensity ratio (I510/I596) and ONOO− concentration from 0 to 10 μM. (c) Fluorescence spectra of MOBDP-I (10 μM) in the presence of 10 μM of ONOO− or 50 μM of other relevant analytes. (d) The fluorescence response intensity (I510/I596) of MOBDP-I to ONOO− (10 μM) and other relevant analytes (50 μM). Analytes: 1O2, ClO−, H2O2, ROO−, ·OH, NO3−, NO2−, H2S, SO32−, HSO3−, GSH, Cys, K+, Na+, Ca2+, Mg2+, Zn2+, Cu2+, Ni2+, Co2+. Samples were measured in PBS (pH = 7.4) at room temperature with λex = 460 nm. The error bars represent ± standard deviation (SD) (n = 3).

