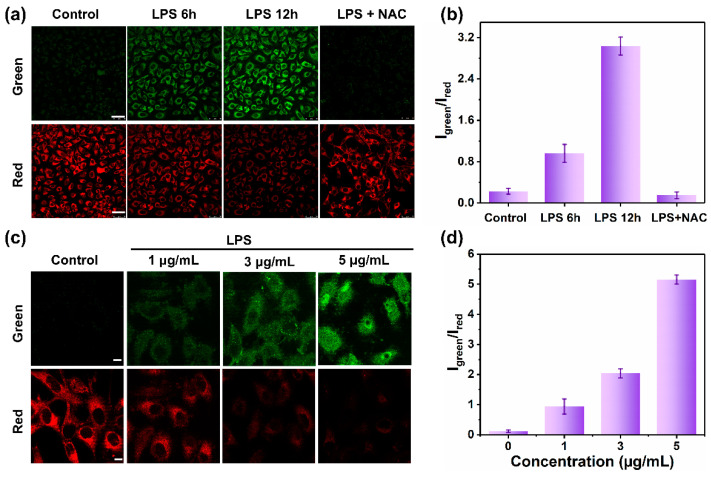
Figure 5.
Fluorescence imaging of endogenous ONOO− in HeLa cells. (a) The cells were treated with LPS (1 μg/mL) for different times and then incubated with MOBDP-I (10 μM). Green channel: λex = 488 nm, λem = 510–540 nm. Red channel: λex = 543 nm, λem = 580–650 nm, scale bar: 50 μm. (b) Fluorescence intensity ratio corresponding to panel (a). (c) The cells were treated with different concentrations of LPS for 6 h and then incubated with MOBDP-I (10 μM). Green channel: λex = 488 nm, λem = 510–540 nm. Red channel: λex = 543 nm, λem = 580–650 nm, scale bar: 10 μm; (d) Fluorescence intensity ratio corresponding to panel (c). The error bars represent ± standard deviation (SD) (n = 3).

