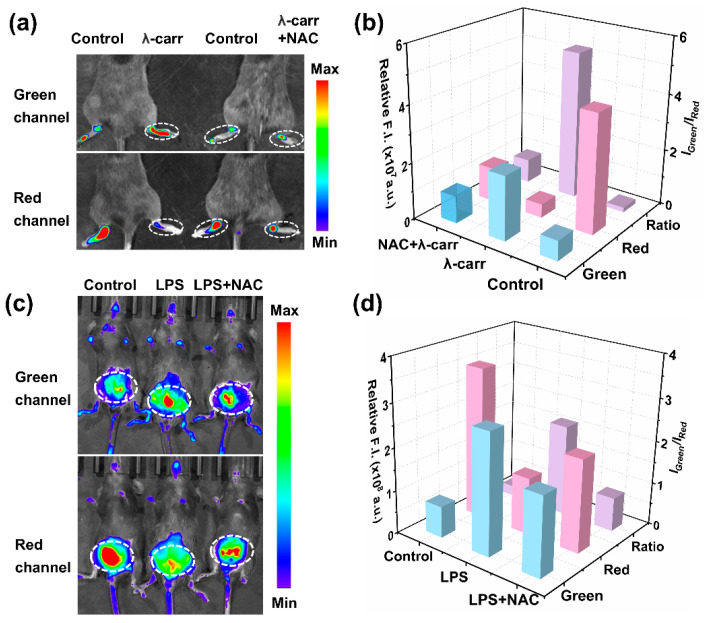
Figure 6.
(a) Fluorescence imaging of MOBDP-I in a mouse model of rheumatoid arthritis. Control group: the left hind limb of mice, in situ injection of PBS (50 μL, 10 mM, pH = 7.0); experimental group: the right hind limb of mice, in situ injection of λ-carr (50 μL, 5 mg/mL) or λ-carr (50 μL, 5 mg/mL) + NAC (50 μL, 30 mg/kg). (b) Relative fluorescence intensities corresponding to panel (a); (c) Fluorescence imaging of MOBDP-I in a mouse model of peritonitis. Control group: intraperitoneal injection of PBS (50 μL, 10 mM, pH = 7.0); experimental group: intraperitoneal injection of LPS (50 μL, 2 mg/mL) or LPS (50 μL, 2 mg/mL) + NAC (50 μL, 30 mg/kg). (d) Relative fluorescence intensities corresponding to panel (c). Green channel, λex = 460 nm, λem = 510–550 nm. Red channel, λex = 570 nm, λem = 650–700 nm.

