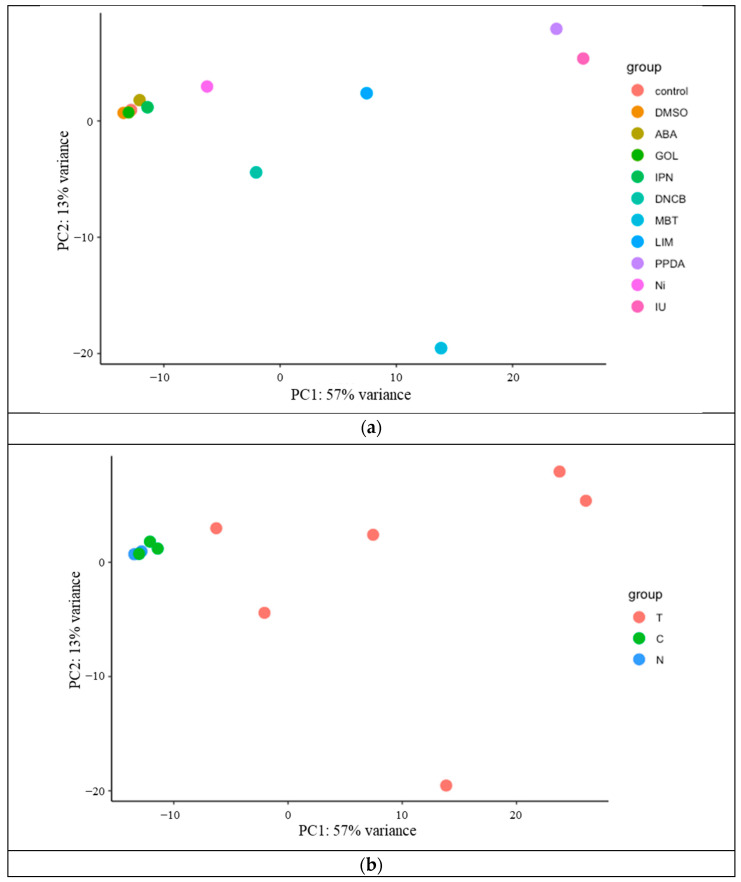
Figure 2.
Principal component analysis of genes expressed in THP-1 cells exposed to sensitizers and non-sensitizers. PC1 and PC2 indicate the first and second principal component scores, respectively. The number shows the contributing ratio of each score. (a) Each circle shows the expression profile of genes in THP-1 cells exposed to different chemicals including the control. (b) Each circle shows the expression profile of genes in THP-1 cells exposed to sensitizers (T), non-sensitizers (C), and controls (N).

