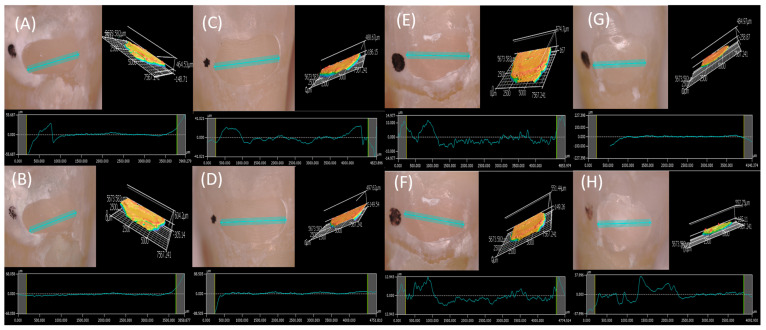
Figure 4.
(A) Post restoration profile (1.202 mm) and surface roughness of Group A restoration. (B) Profile (1.202 mm) and surface roughness after 5 clinical years of Group A restoration. (C) Post-restoration profile (1.202 mm) and surface roughness of the Group D restoration. (D) Profile (1.202 mm) and surface roughness after 5 clinical years of the Group D restoration. (E) Post-restoration profile (1.202 mm) and surface roughness of the Group B restoration. (F) Profile (1.202 mm) and surface roughness after 5 clinical years of the Group B restoration. (G) Post-restoration profile (1.202 mm) and surface roughness of the Group C restoration. (H) Profile (1.202 mm) and surface roughness after 5 clinical years of the Group C restoration.

