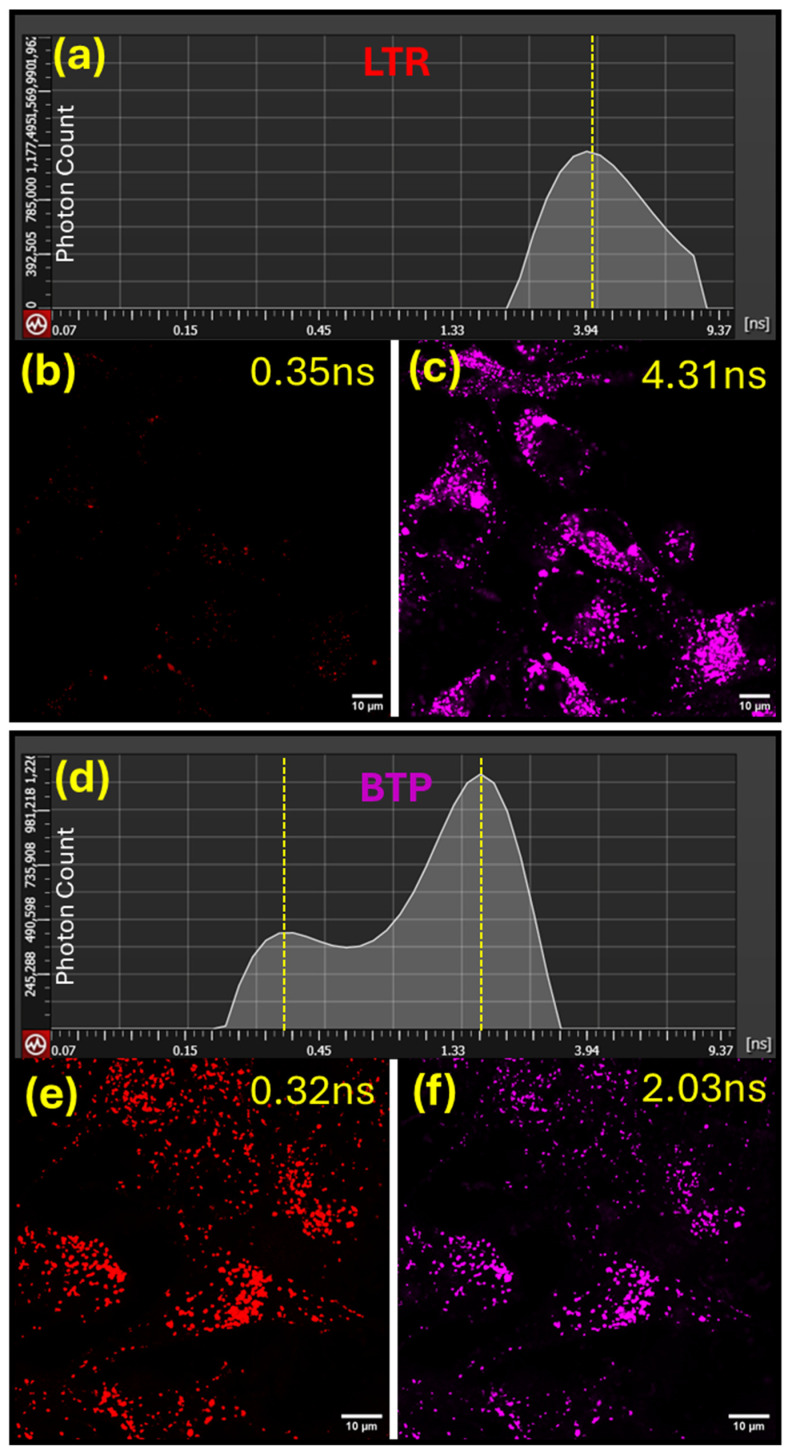
Figure 6.
Fluorescence confocal microscopy analysis of MG-63 cells stained with LysoTrackerTM red DND-99 (b,c) and BTP (e,f) to study their emitted photon population based on the averaged arrival time (AAT). Figures (a,d) illustrate the emitted photon distribution based on the AAT for LysoTrackerTM red DND-99 (a) and BTP (d).

