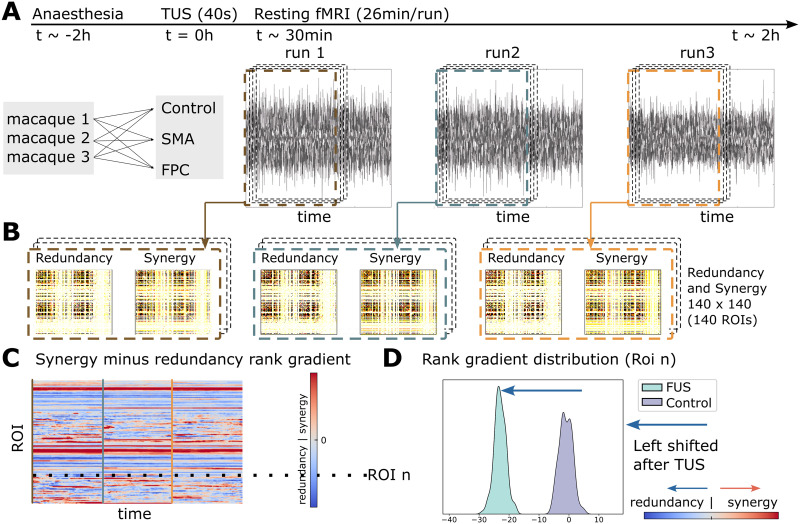
Figure 2. .
(A) Three macaques participated in FPC-TUS, SMA-TUS, and non-TUS. (B) We computed the redundancy and synergy matrices over 60 sliding windows of 500 s with 99% overlap. (C) The matrices are averaged across rows and then ranked. The result of those synergy minus redundancy vectors is the rank gradient (Luppi et al., 2022). (D) Per Region of interest (ROI), we compared the gradient rank distribution over time (dotted line) between the control and TUS, obtaining a shift to more redundant (blue arrow) or synergistic (red arrow) interactions.

