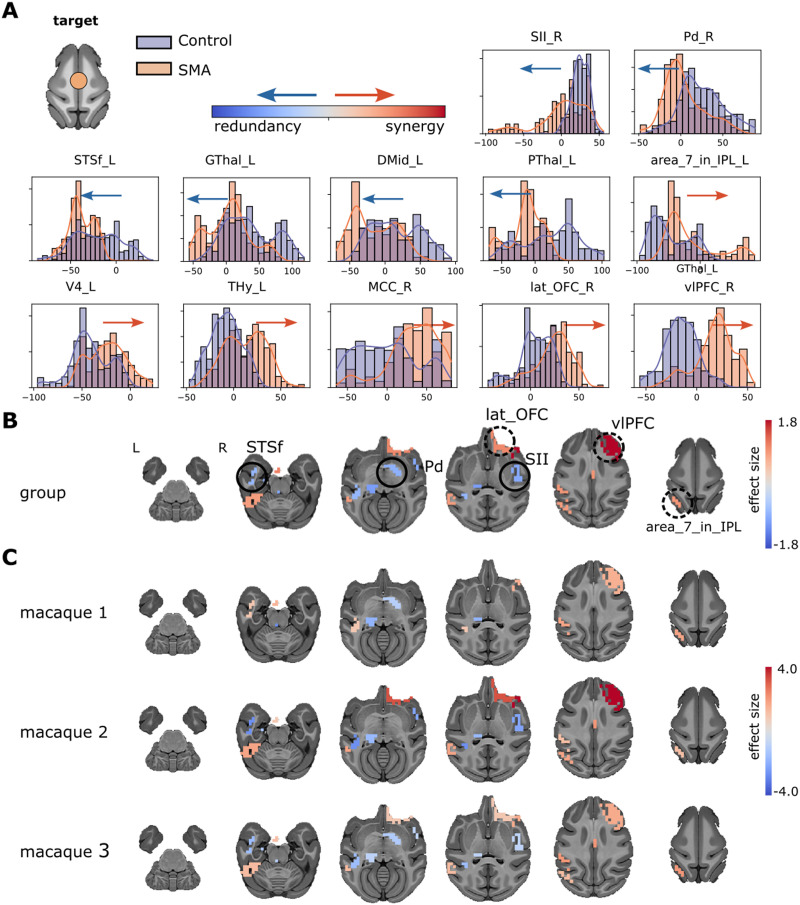
Figure 3. .
(A) Synergy minus redundancy rank gradient distribution after the TUS of the SMA target. The left shift (blue arrow) represents a region participating in more redundant (or less synergistic) interactions over time after TUS. In contrast, the right shift (red arrow) represents a more synergistic (or less redundant) interaction over time after TUS. (B) The brain maps illustrate the shift to the left (blue color) or right (red color), and the magnitude is the effect size. We compared the gradient rank distribution of each ROI over time between the control (non-TUS) and the TUS experiment among the three macaques together, using a Wilcoxon rank-sum test and correcting by Bonferroni and effect size bigger than 0.8. (C) Similar to B, but for each macaque separately.

