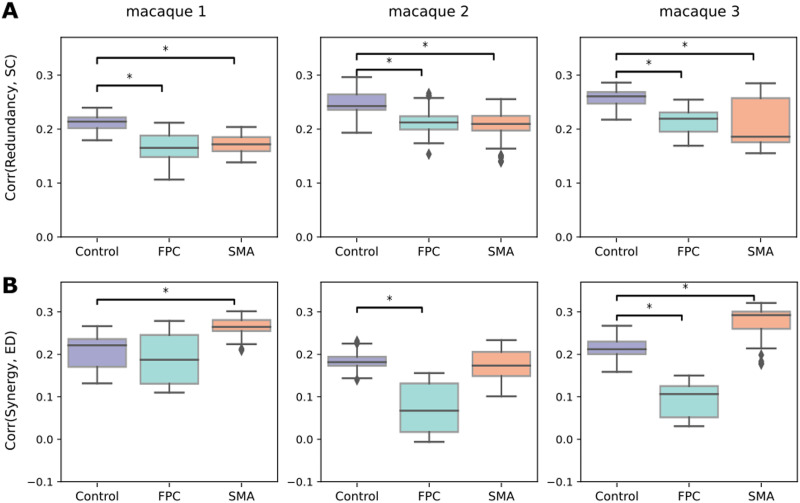
Figure 5. .
(A) Correlation between SC and redundancy. (B) Correlation between the ED and synergy per experiment and macaque (at each column). The y-axis values contain the Spearman’s rank correlation coefficient. The colors represent the control (non-TUS) and the two experiments: SMA-TUS and FPC-TUS. We corrected by Bonferroni and effect size bigger than 0.8.

