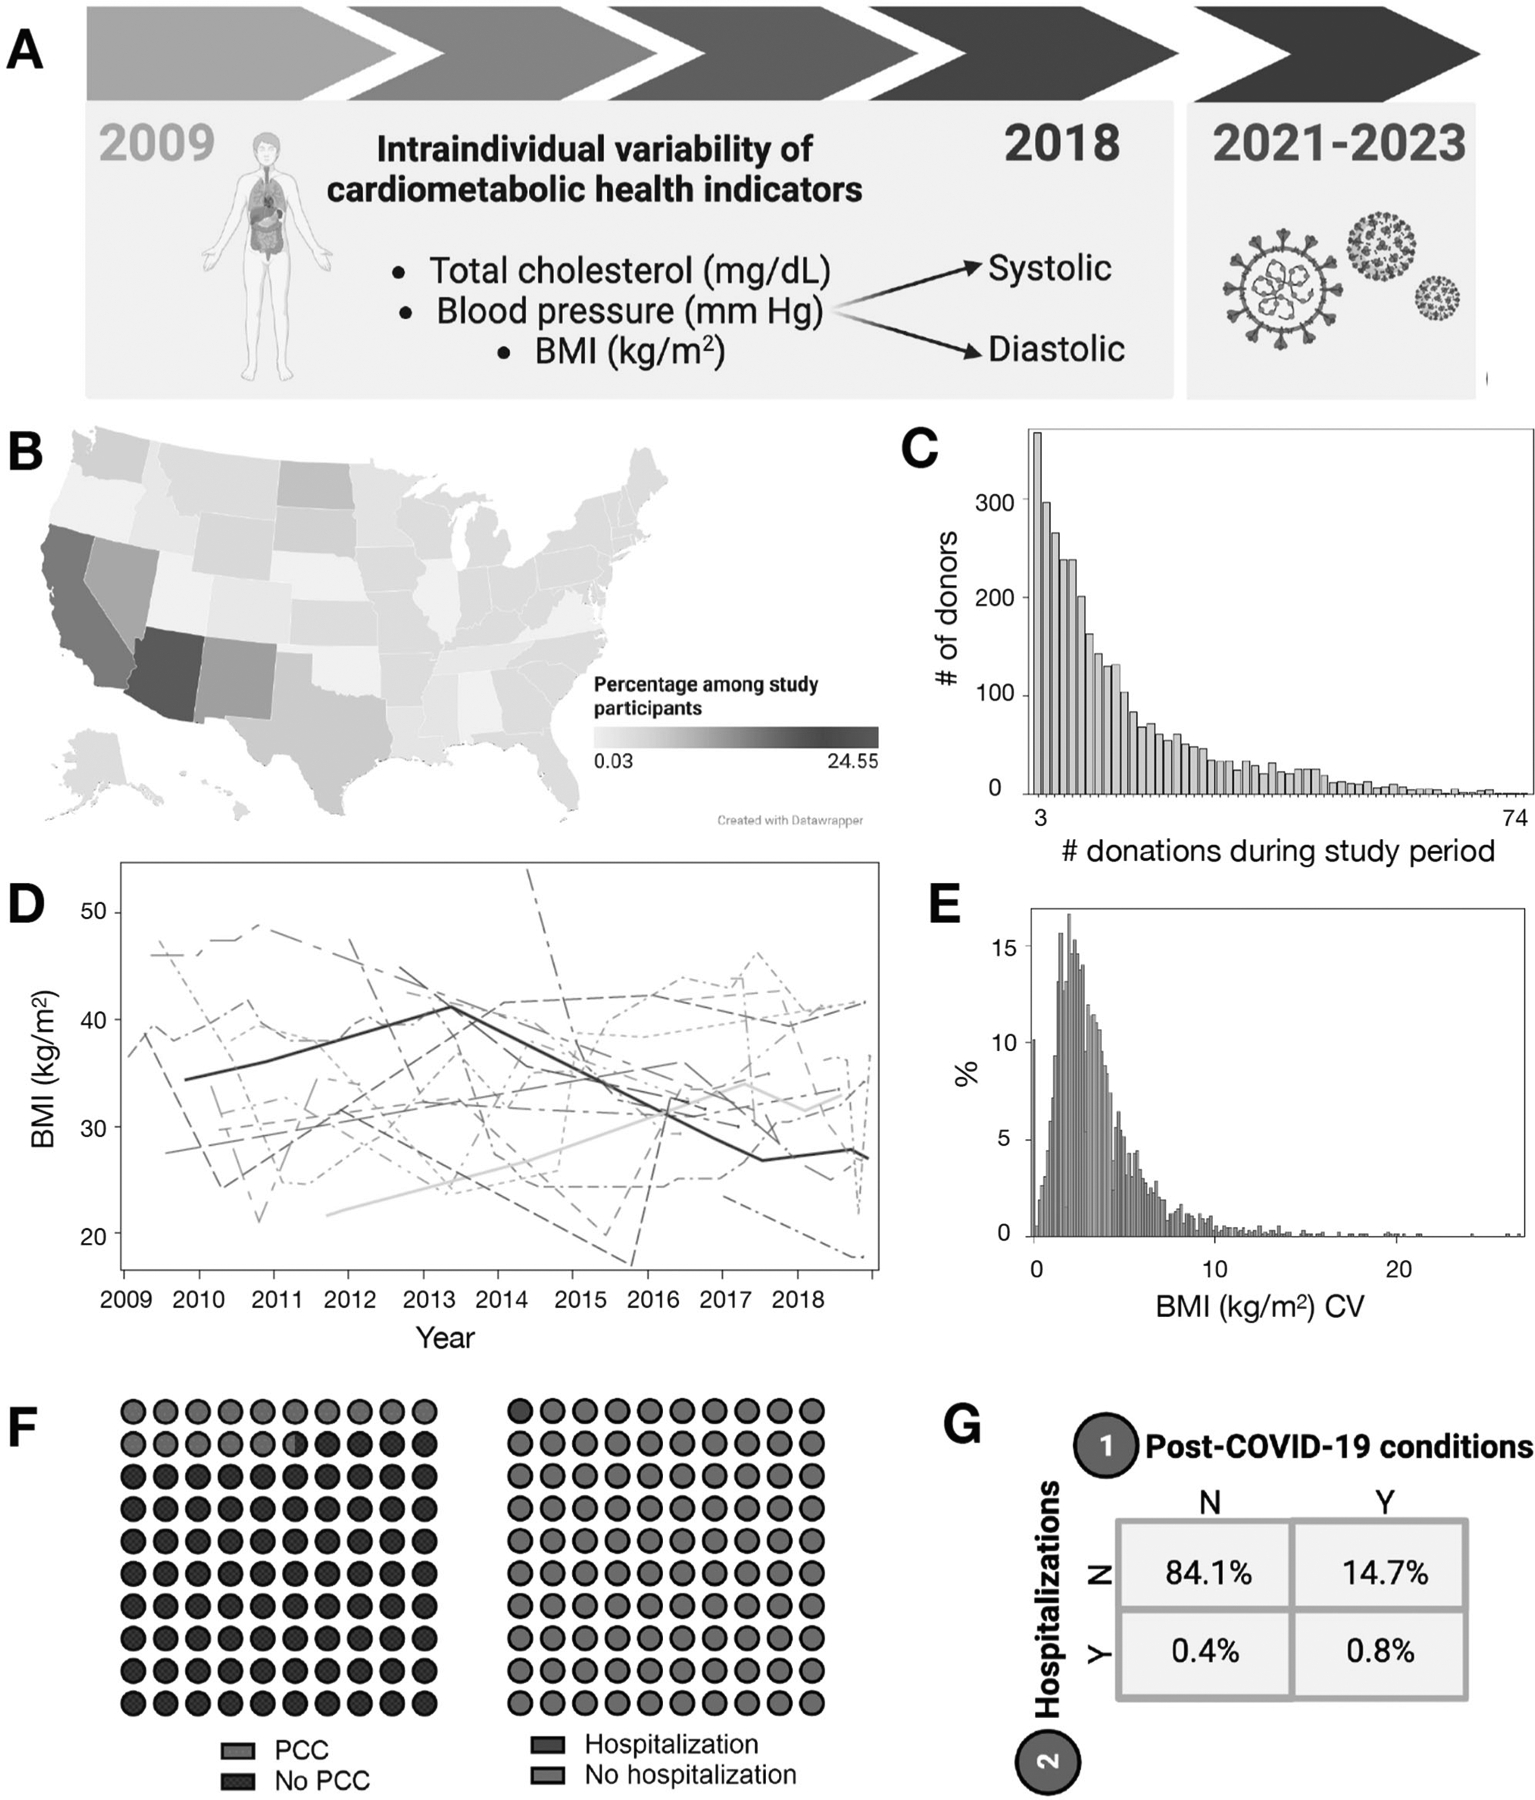
Fig. 1. Visual overview of study design, primary exposures and outcomes.

A In this retrospective cohort study, intraindividual variability in cardiometabolic indicators were the primary exposures of interest (2009–2018 data collection) and post-COVID conditions and hospitalizations (2021–2023 surveys) were the primary outcomes. Figure created with BioRender.com. B Donors visited blood collection sites in 24 US states. Figure created with Datawrapper. C Total donations per donor in final analytic dataset. Among study participants, 3–74 allogeneic blood donations (whole blood, plasma) per donor were provided during 2009–2018. D BMI (kg/m2) at each donation timepoint among top 20 participants with the highest intraindividual variability (CV). E Among all participants, the distribution of BMI CV (overall, stratified by BMI CV quartile) are in the histogram. F, G Percentages of participants with PCC and COVID-19 hospitalization, respectively and as a contingency table. BMI body mass index, CV coefficient of variation, PCC post-COVID conditions.
