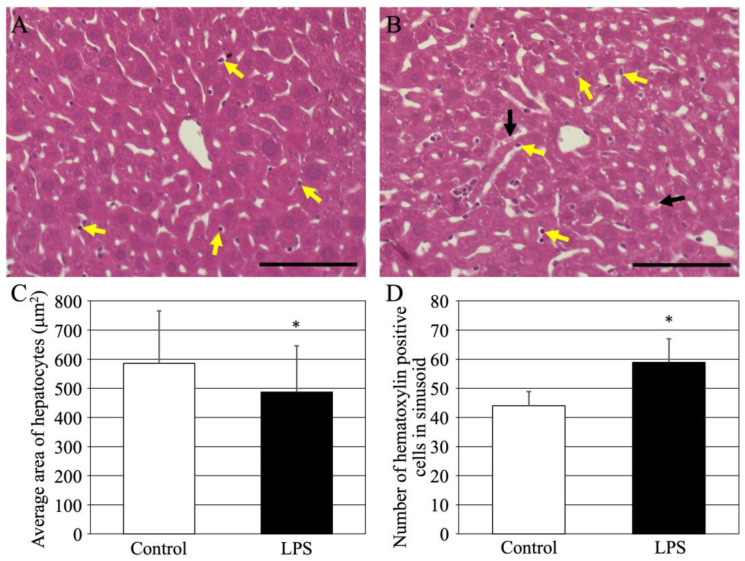
Figure 1.
HE-stained images of livers from normal mice (A) and LPS-treated mice (B). Yellow arrows indicate hematoxylin-positive cells in the sinusoids. Black arrows indicate hematoxylin-negative cells within the sinusoids. Scale bars in (A,B) are 100 μm. (C) Average area in control (white bar) and LPS-treated mice (black bar) of hepatocytes (200 cells/animal, four animals from each group). (D) Number of hematoxylin-positive cells within sinusoids in control (white bar) and LPS-treated mice (black bar) of (numbers/200,000 μm2, 10 pictures/animal, four animals from each group). Each graph shows the mean ± standard deviation. *; p < 0.05 compared to control value. HE, hematoxylin-eosin; LPS, liposaccharide. All sale bars are 100 μm.

