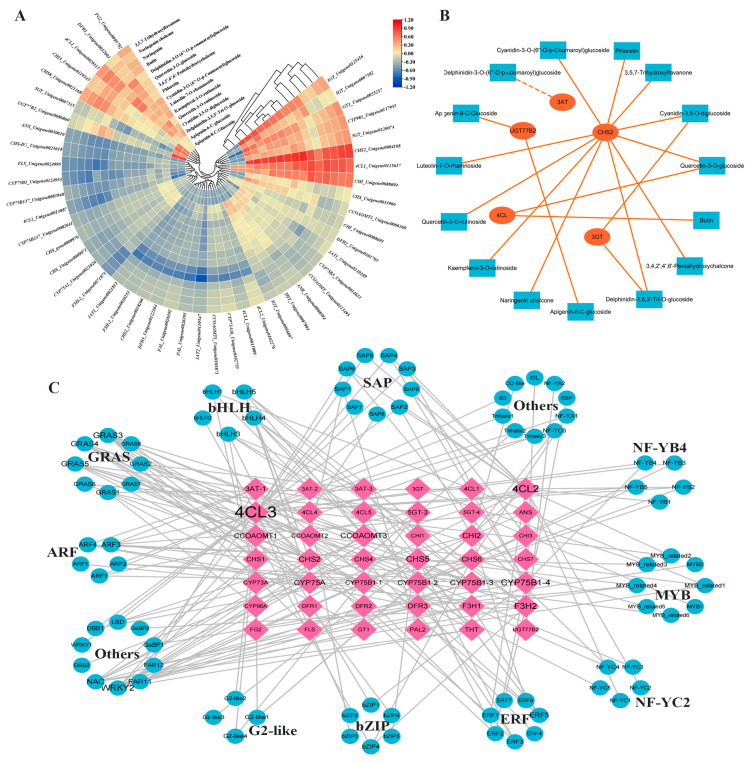
Figure 5.
(A) Correlation analysis of flavonoid metabolites with flavonoid biosynthesis genes (red color indicates high correlation, blue color indicates low correlation). (B) Flavonoid structural gene and metabolites network interactions graph (blue boxes indicate metabolites, orange circles indicate gene). (C) Network diagram of the correlation between key structural gene and TFs (pink diamonds indicate DEGs, blue circles indicate TFs).

