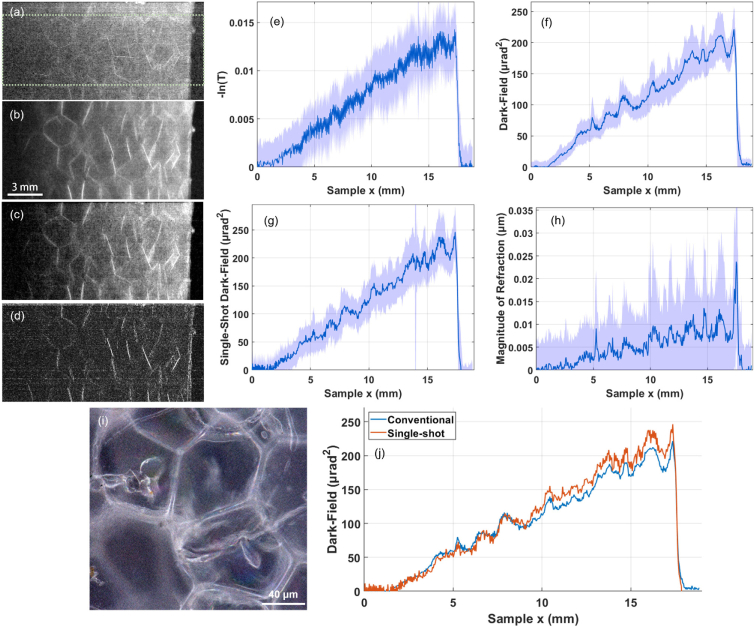
Fig. 2.
Images and profiles of polystyrene wedge phantom with (a)+(e) attenuation contrast, (b)+(f) dark-field contrast, (c)+(g) single-shot contrast using Eq. (7), assuming , and (d)+(h) the absolute value of the refraction signal, . Profiles are taken by averaging all rows within the green ROI, with error bars taken as the standard deviation in the y-axis of the image, and graph horizontal axes correspond the to x-coordinates of the image. The sub-resolution features are resolved in (i) using a light microscope. Conventional and single-shot dark-field contrast are shown together in (j). The profiles match exactly at the thinnest edge due to the lack of attenuation, and start to deviate as the sample shows higher attenuation as the wedge thickness increases, breaking the assumption of a pure-phase object.

