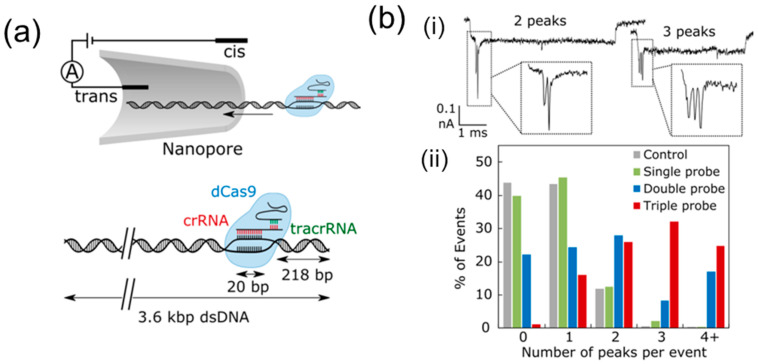
Figure 15.
Mapping of recognition sites on DNA. (a) Single dCas9 probes bound to 3.6 kbp DNA translocating through a nanopore. (b) Double and triple dCas9 probe barcodes on full-length λ-DNA. (i) Example events with two and three peaks due to binding of the double-probe barcode and triple-probe barcode, respectively. (ii) Raw data comparing the number of peaks counted per event after the addition of a single probe, double probe, and triple probe. Reprinted with permission from [117]. Copyright 2019, American Chemical Society.

