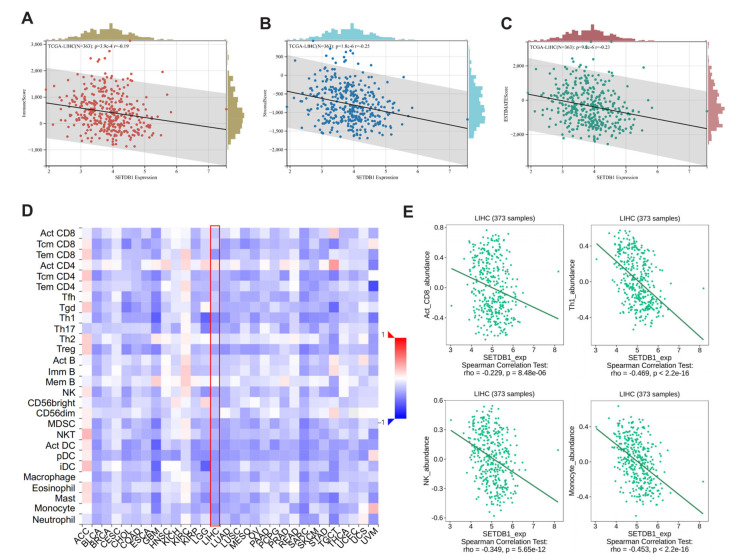
Figure 6.
Correlation analysis between SETDB1 and immune microenvironment. Correlation of SETDB1 with Immune score (A), Stromal score (B), and ESTIMATE score (C) in HCC. (D) The landscape of the relationship between SETDB1 expression and TILs in multiple types of cancers (red denotes positive correlation, and blue denotes negative correlation). (E) SETDB1 expression was significantly negatively associated with infiltrating levels of act_CD8, Th1, NK, and Monocyte in HCC.

