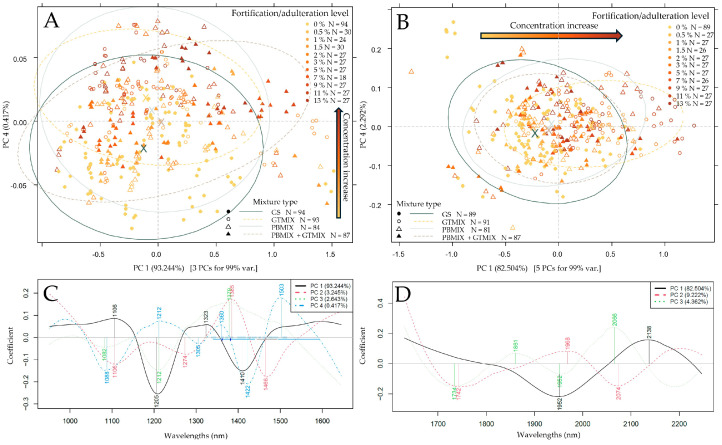
Figure 5.
PCA results to separate measurement points based on additive concentration (gold-brown gradient coloring) and mixture types (marker type and ellipses). Savitzky–Golay filter with second-order polynomial and 21 smoothing points, detrending and SNV as pretreatment: (A) PCA score plot based on MicroNIR data; (B) PCA score plot based on microPHAZIR data; (C,D) corresponding loading vectors.

