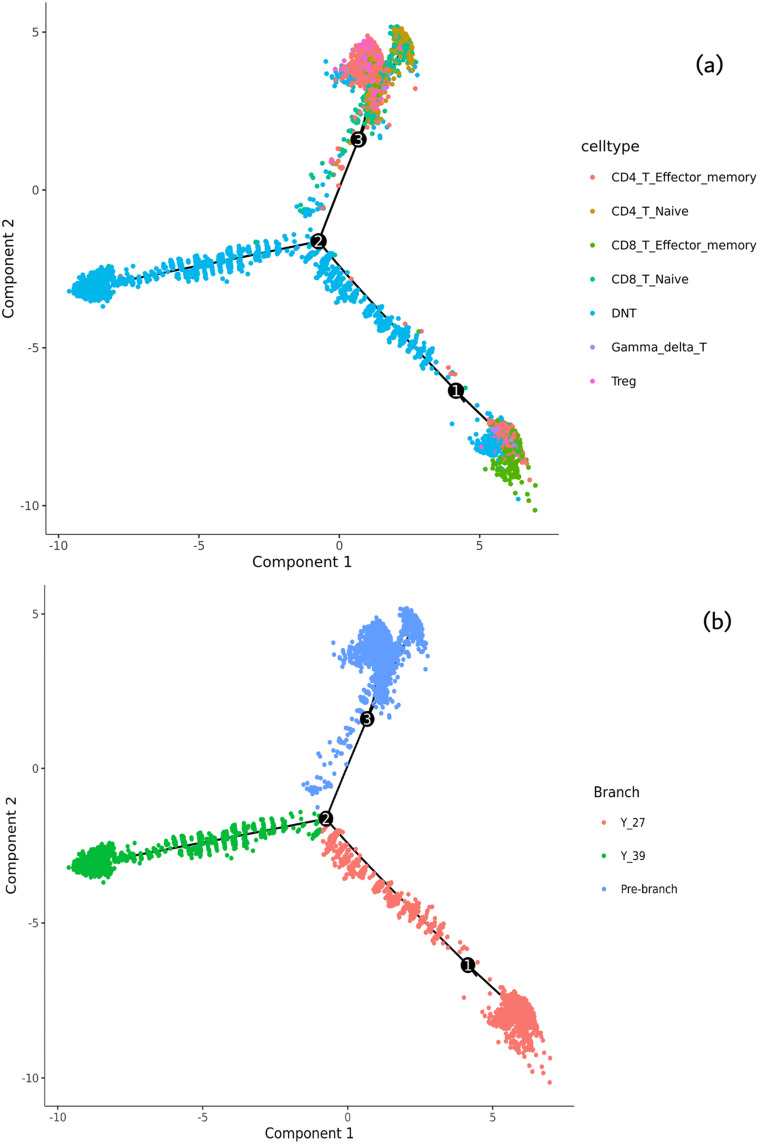
Figure 11.
Results of the pseudotime trajectory analysis. Each dot represents a single cell. The black lines indicate the main differentiation trajectories of the cells, and the black circles with numbers are the important nodes on the differentiation trajectories. (a) Each colour represents a certain type of T cell. (b) Each colour represents a certain branch of the trajectory.

