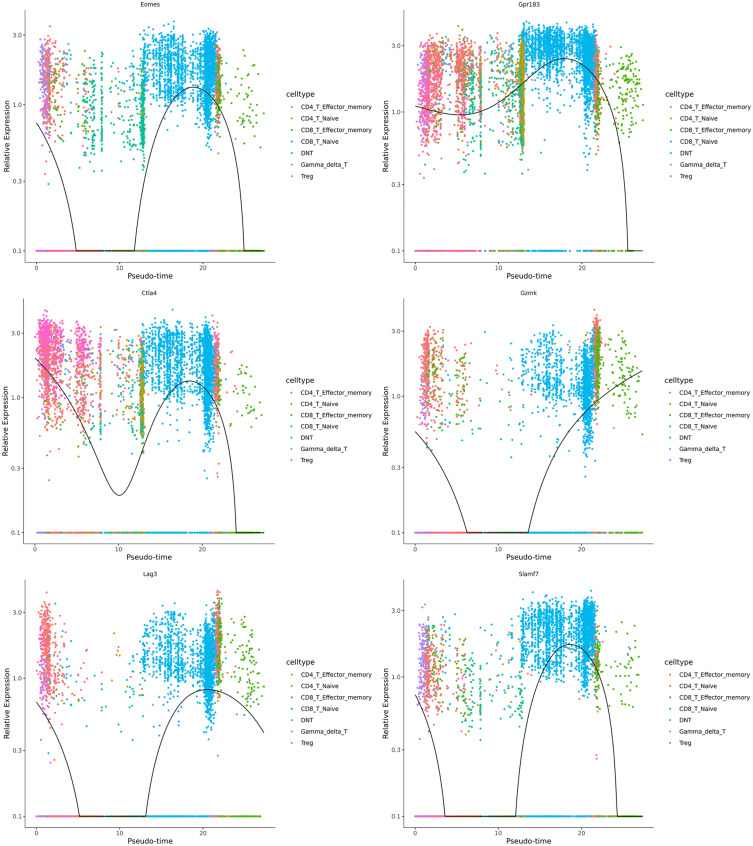
Figure 12.
The expression levels of Eomes, Gpr183, Ctla4, Gzmk, and Slamf7 according to pseudotime analysis. Each dot represents a single cell. The colour of the dot indicates the cell type, the abscissa is the pseudotime, the ordinate is the expression level of the specified gene in the cell, and the black curve indicates the trend of the gene between different cells with pseudotime.

