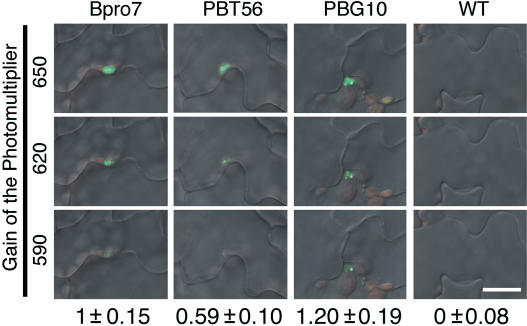
Figure 4.
Quantitative Analysis of the phyB-GFP Fluorescence in Epidermal Cells.
PhyB-GFP fluorescence in epidermis was observed by confocal microscopy with different photomultiplier settings. The gain was set to 650 (top), 620 (middle), or 590 (bottom). Numbers ±se below indicate relative intensity of the phyB-GFP fluorescence in epidermal cells. The gain was set to 650, and the fluorescence intensity within the nuclear region was integrated for each nucleus. n = 10 to 14. Bar = 20 μm.

