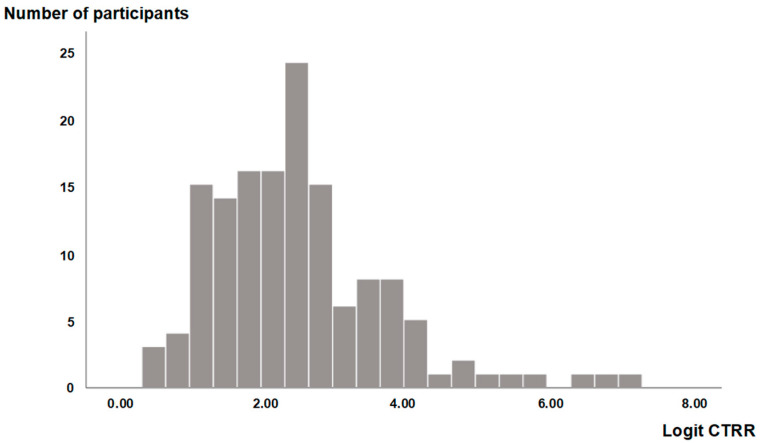
Figure 3.
Histogram of Logit CTRR values. This histogram shows the distribution of Logit CTRR values. The x-axis represents Logit CTRR values, ranging from approximately 0 to 8, and the y-axis indicates the frequency of occurrences in each range. The distribution of this histogram closely approximates a normal distribution.

