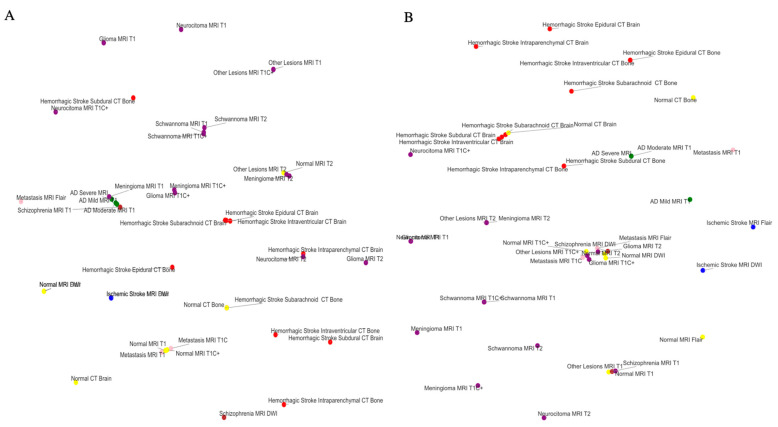
Figure 2.
Euclidean and hyperbolic model T-SNE in the Neuroimaging Dataset. This Figure shows the low-dimensional representation T-SNE of the average class embedding space from the Euclidean ResNet 18 (A) and the Euclidean–Lorentz ResNet 18 (B) for the Multi-Modality Neuroimaging (MMN) Dataset. The colors denote the broader category per class.

