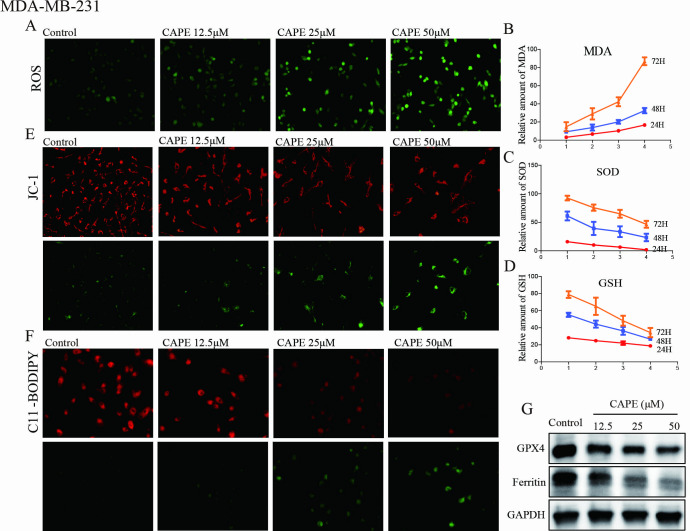
Fig 2. CAPE induced cell ferroptosis of MDA-MB-231 cells.
(A) Cells were treated with CAPE (12.5, 25, 50 μM) for 24 h, and DCFH-DA was used for ROS detection. (B-D) Cells were treated with CAPE (12.5, 25, 50 μM) for 24 h to investigate MDA, SOD and GSH levels. (E) Cells were treated with CAPE (12.5, 25, 50 μM) for 24 h, and JC-1 staining was used to detect the mitochondrial membrane potential. (F) Cells were treated with CAPE (12.5, 25, 50 μM) for 24 h, and the lipid peroxidation was determined by C11-BODIPY staining. (G) Cells were treated with CAPE (12.5, 25, 50 μM) for 24 h, and western blot was used to detect the expression of GPX4 and Ferritin. Values represent the mean ± SD from three independent experiments.

