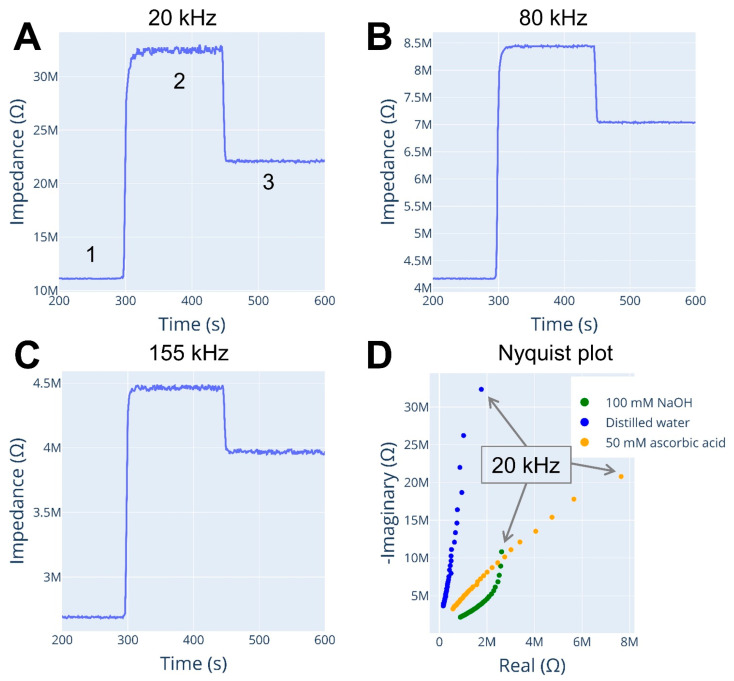
Figure 3.
Detector response during capillary rinsing procedure. Time series at excitation of (A) 20 kHz, (B) 80 kHz, (C) 155 kHz. (D) Nyquist plots represent a spectrum of each rinsed solution. Annotations: 1—100 mM NaOH, 2—distilled water, 3—50 mM ascorbic acid. Fused silica capillary used: 50 µm I.D., 365 µm O.D., 58 cm Ltot, 46 cm Leff. Sweep: 20–190 kHz frequency, 3.3 Vpp amplitude.

